Unlike traditional imagery—which reveals the impact of irrigation issues only after the fact—Ceres Imaging’s Water Stress Index provides a precise and accurate measure of crop stress in real time. We combine proprietary crop models with thermal imagery capable of capturing temperature differences as small as 0.1 degree Celsius between plants. In 20% of the fields we fly, we detect an irrigation issue affecting more than five acres.
Ceres Imaging can assess the relationship between plant transpiration and the crop canopy's surface temperature. Our analysis of the data is powered by machine learning, allowing us to rapidly identify individual plants or areas of the crop canopy that exhibit a stress response. Full-canopy measurements of water stress are categorized by severity using established benchmarks specific to crop type and maturity.
The Water Stress Index presents this analysis as a simple and intuitive classification, translating the complexity of multispectral imagery into an easy-to-understand representation of stressed and non-stressed areas of a field. In 20% of the fields we fly, we detect an irrigation issue affecting more than five acres.
High-resolution multispectral imagery is only the beginning. Our analytics tools help you interpret your data—translating what you can see in your imagery into what you can do about it.
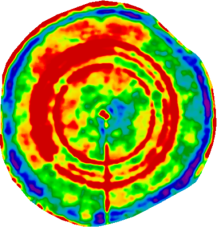
The red rings show where a clogged nozzle has resulted in underwatering.
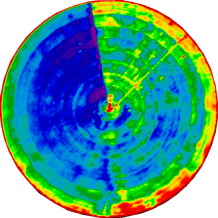
An irrigation pressure issue presents as a gradual increase in crop stress toward the edge of the field.
The stressed area in this field was found to have drip line damaged by rodents.
The irrigation system in this field needs improvements to match the terrain: the imagery shows underwatering on the uphill end of the field.
We capture imagery during peak daylight hours and under weather conditions that minimize distortion from shadows and cloud cover. Our highly sensitive, custom-built cameras detect minute changes in the multispectral range—allowing us to detect crop stress earlier than our competitors.
Imagery is geo-referenced and meticulously “masked” to ensure that only relevant information is evaluated. By making use of crop-specific data models and isolating the canopy from ground cover and other background noise, we prevent skewing of the data and enable a more accurate assessment of plant health.
Imagery is assessed in-house by Ceres Imaging’s remote sensing experts, passing through multiple checkpoints before delivery in the Ceres Imaging app within 48 hours of the flight. Growers can access their data on a mobile device, tablet, or desktop computer.
The difference between Ceres Imaging and other technologies I've used is the help I get from their expert team.
With Ceres Imaging we can take a more targeted approach to applying fertilizer and nutrients.
These flights can cover way more ground and provide more insight than a dozen soil moisture probes — and it's cheaper to implement.
The average Ceres Imaging conductance measurement from its imagery over the season has provided the best correlation with applied water.
360 22nd St., Suite 200
Oakland, CA 94612
+1 888-704-9398
support@ceresimaging.net
Landmark Center
1299 Farnam St., Suite 300
Omaha, NE 68102
Bellefield Office Park
1400 112th Ave SE, Suite 100
Bellevue, WA 98004