
Water Demand Maps
In challenging conditions, precision irrigation requires more than guesswork. Water Demand Maps from Ceres Imaging use aerial data from your fields to help you visualize variability across your operation, so you can confidently conserve water without compromising crop health.
Common uses
-
Visualizing variable conditions across large operations
-
Optimizing use of limited water resources to protect yields
-
Improving uniformity
-
Adjusting irrigation schedules to respond to crops’ changing needs
How it works
When water is scarce, costly, or both, farm profits depend on irrigating only as much as necessary to protect yields. But for many busy growers, identifying where and how water needs vary across a large operation can depend on guesswork—estimating with generic crop coefficients that may not match real-world conditions in the field.
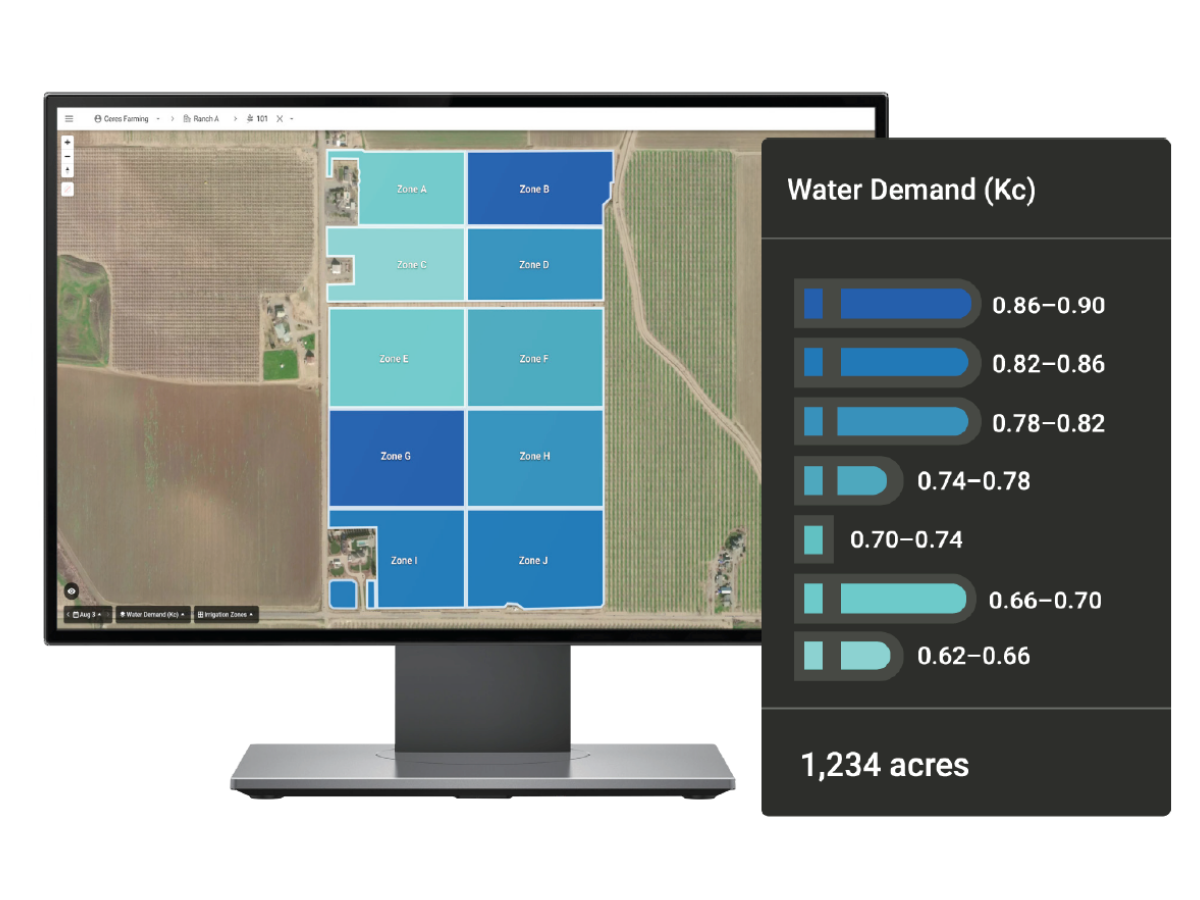
Now, Water Demand Maps provide a powerful alternative. Ceres Imaging assesses variability in your crop canopy to generate Kc values specific to your fields, then maps these custom values to your existing irrigation zones. The result: an intuitive and highly customizable tool to guide irrigation scheduling and strategy.
Customized for your farm
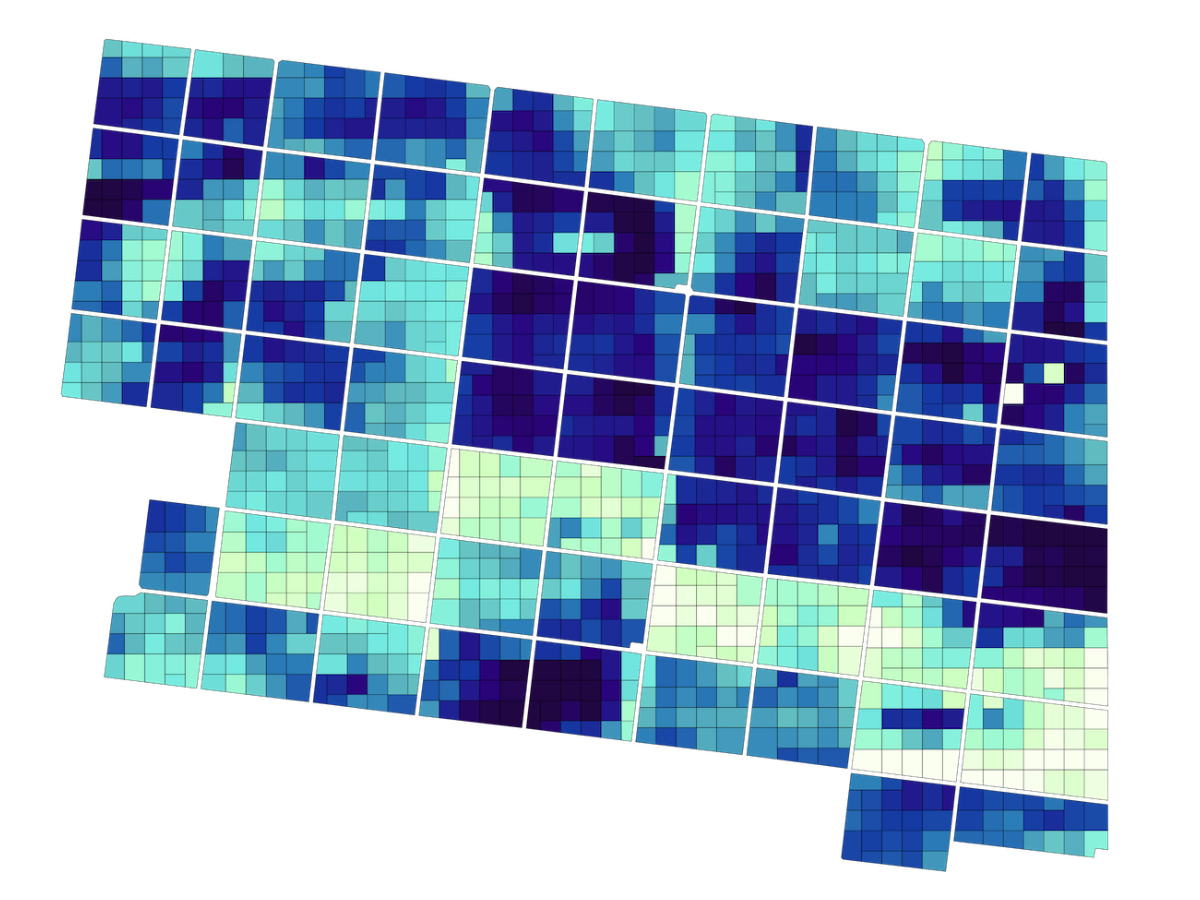
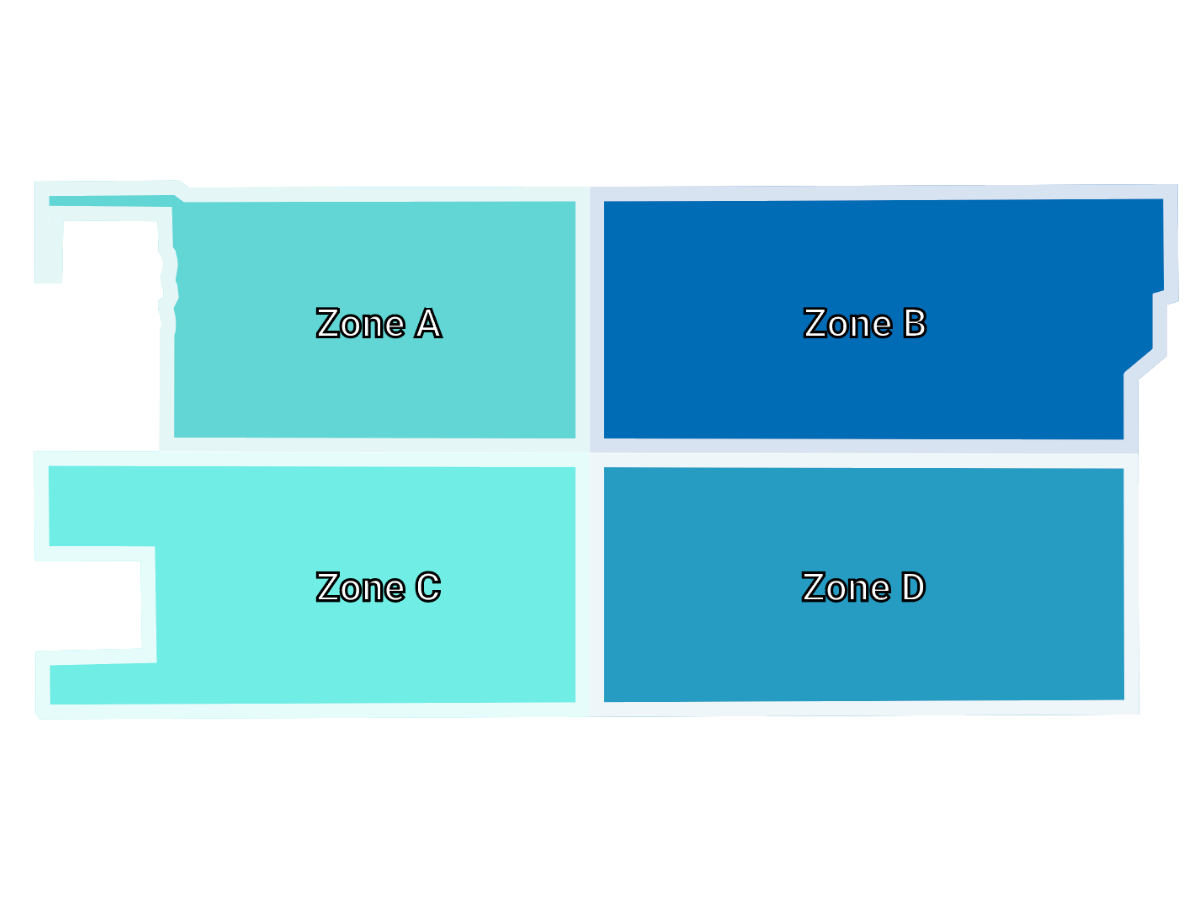
Ceres Imaging delivers Water Demand Maps customized to your operation: see variability in each field’s water demand mapped by acre, or to your existing irrigation zones. Instead of generic crop coefficients, you’ll get Kc values calculated from aerial assessments of your crop’s canopy cover.
Water Demand Maps are available for tree nuts, grapes, and citrus crops.
Ensuring accuracy
Ceres Imaging’s emphasis on quality begins even before we fly your fields.
Image capture
We capture imagery during peak daylight hours and under weather conditions that minimize distortion from shadows and cloud cover. Our highly sensitive, custom-built cameras detect minute changes in the multispectral range—allowing us to detect crop stress earlier than our competitors.
Processing and analysis
Imagery is geo-referenced and meticulously “masked” to ensure that only relevant information is evaluated. By making use of crop-specific data models and isolating the canopy from ground cover and other background noise, we prevent skewing of the data and enable a more accurate assessment of plant health.
Quality control
Imagery is assessed in-house by Ceres Imaging’s remote sensing experts, passing through multiple checkpoints before delivery in the Ceres Imaging app within 48 hours of the flight. Growers can access their data on a mobile device, tablet, or desktop computer.
More imagery and analytics
![]()
Get started with Ceres
Schedule a consultation for detailed product info, pricing, and more.

The difference between Ceres Imaging and other technologies I've used is the help I get from their expert team.
With Ceres Imaging we can take a more targeted approach to applying fertilizer and nutrients.
These flights can cover way more ground and provide more insight than a dozen soil moisture probes — and it's cheaper to implement.
The average Ceres Imaging conductance measurement from its imagery over the season has provided the best correlation with applied water.