NDVI measures the difference between visible and near-infrared (NIR) light reflectance from vegetation to create a snapshot of photosynthetic vigor.
Vegetation in a vigorous canopy will absorb visible light and reflect most NIR light—whereas a sparse canopy will reflect more visible light and less NIR light. The imagery represents these differences in light reflectance using a color classification ranging from red to green, with red indicating the least vigorous crop canopy.
NDVI imagery is most powerful and cost-effective when used in conjunction with Ceres Imaging’s Chlorophyll Index, which provides a complementary view of the quality—rather than the density—of the crop canopy. Together, the two types of imagery tell a holistic story of plant health and nutrient availability, helping growers pinpoint insect and disease pressures and areas of poor soil fertility in each field.
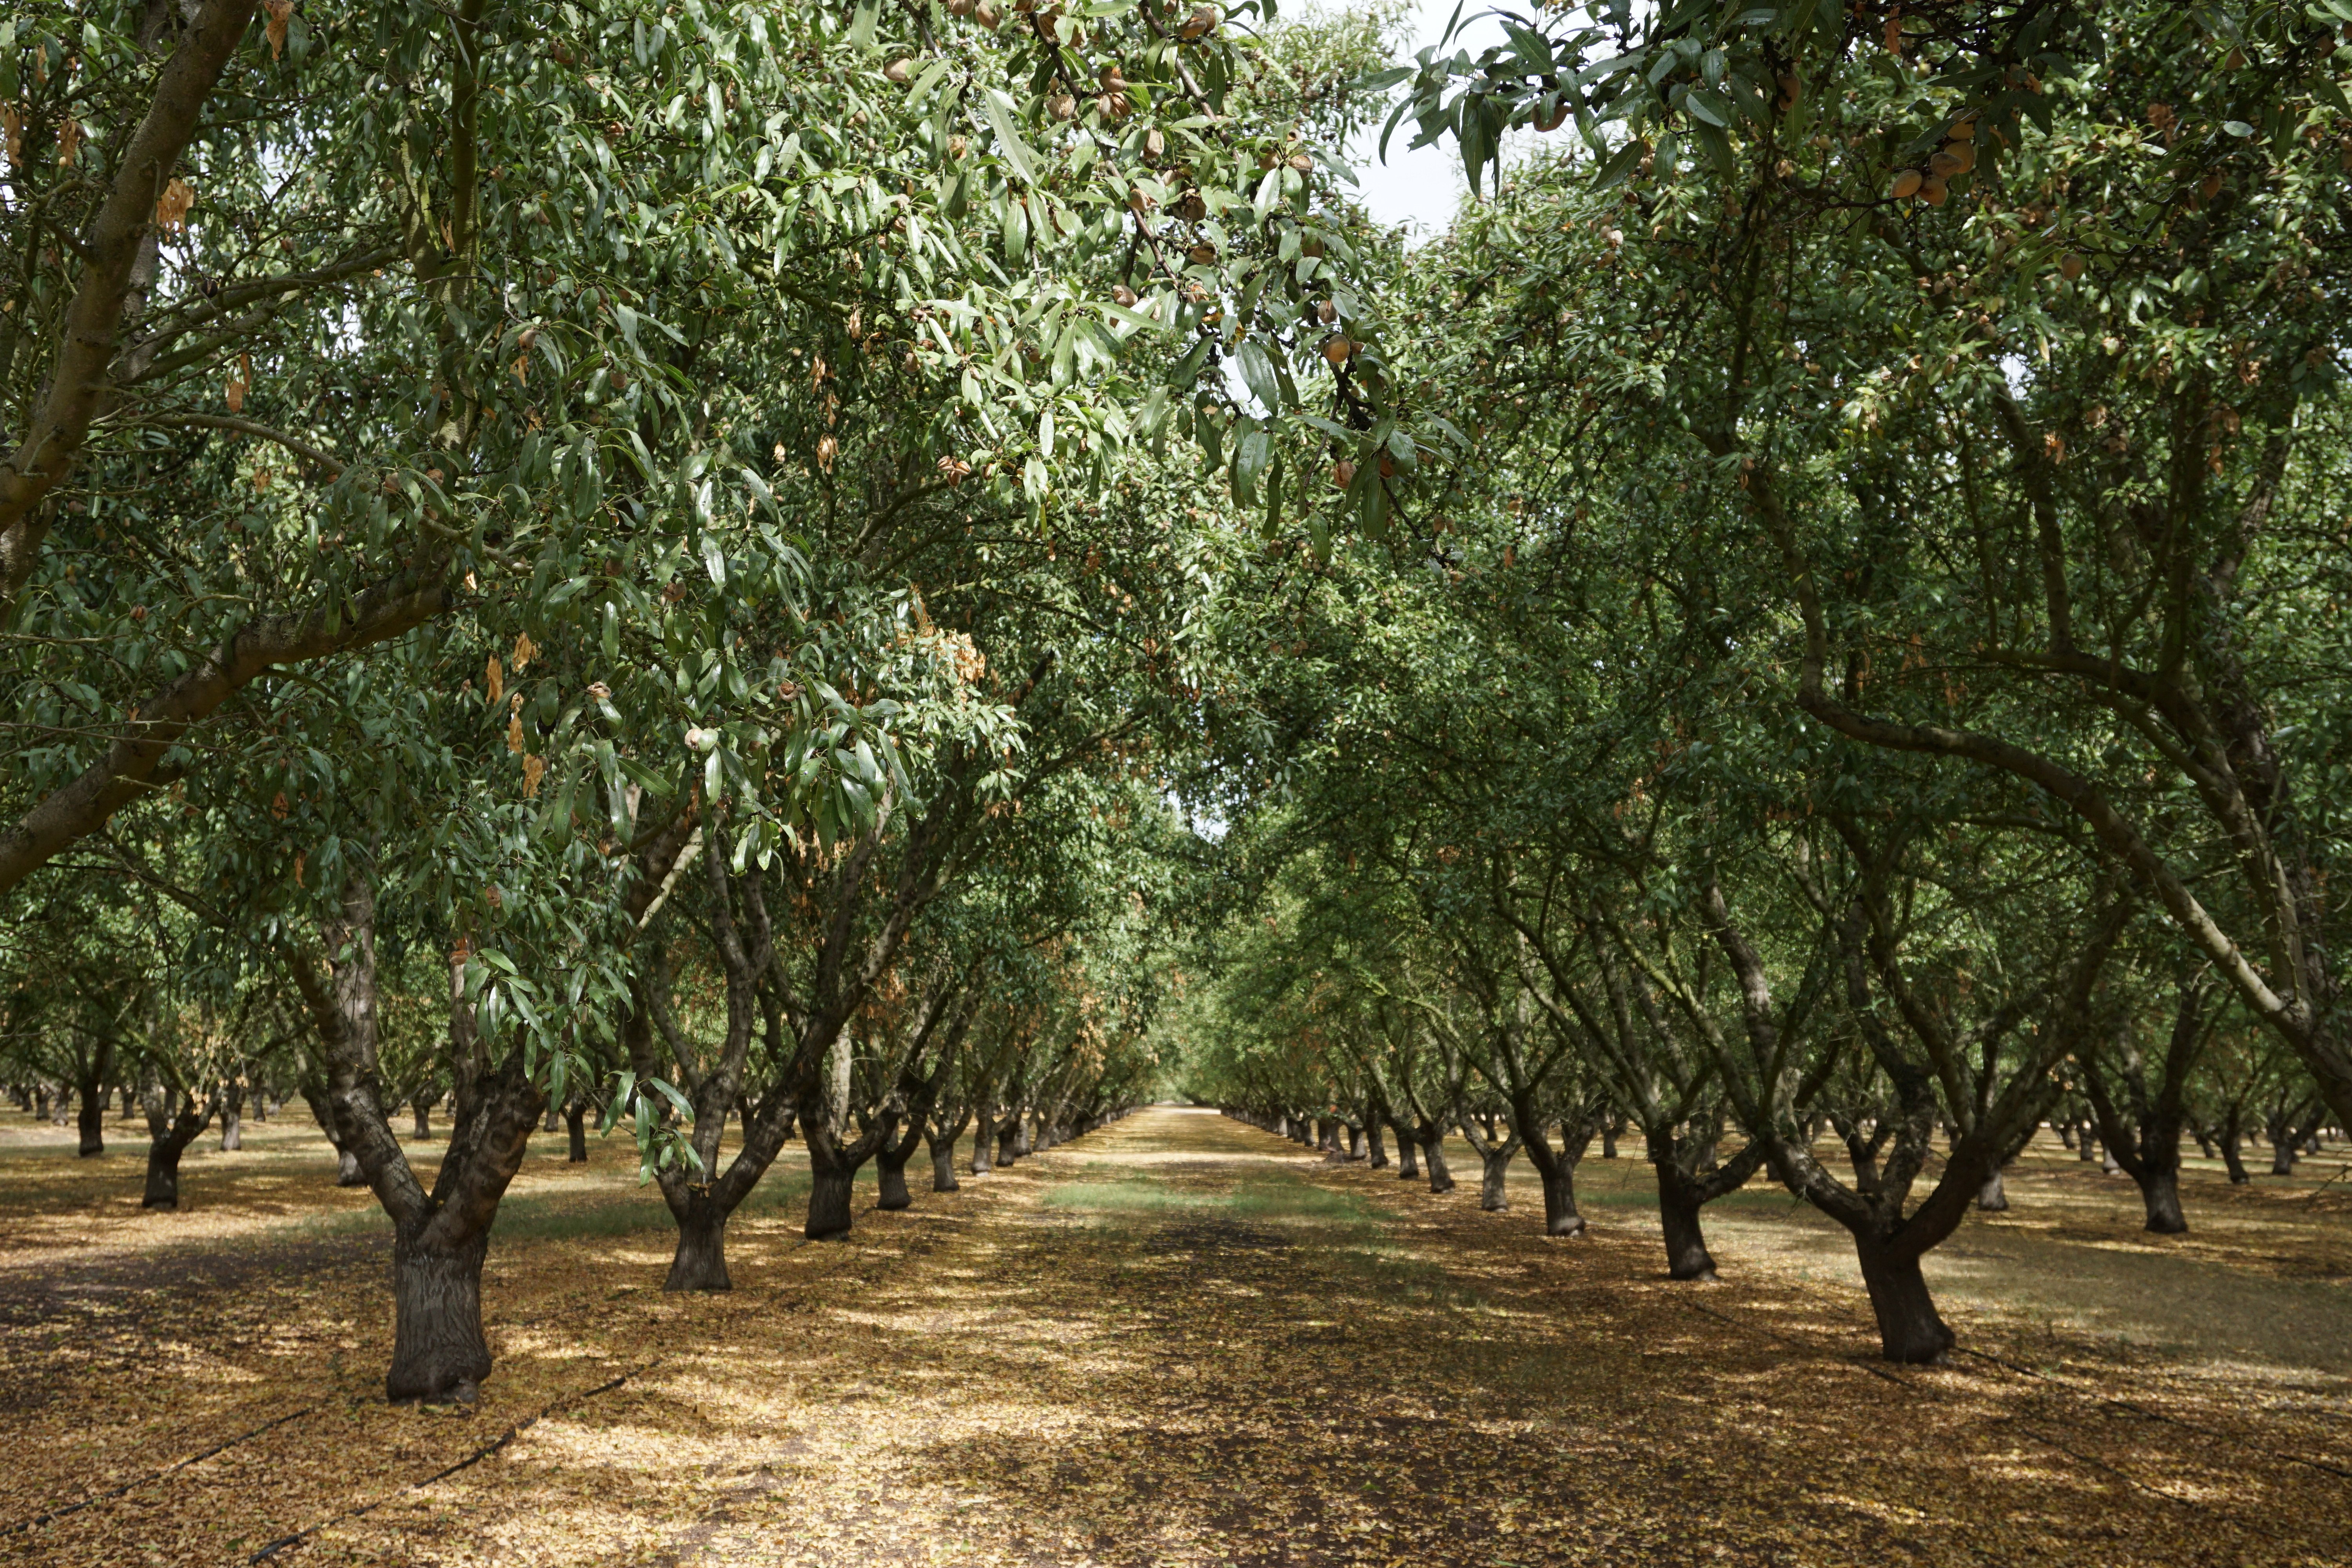
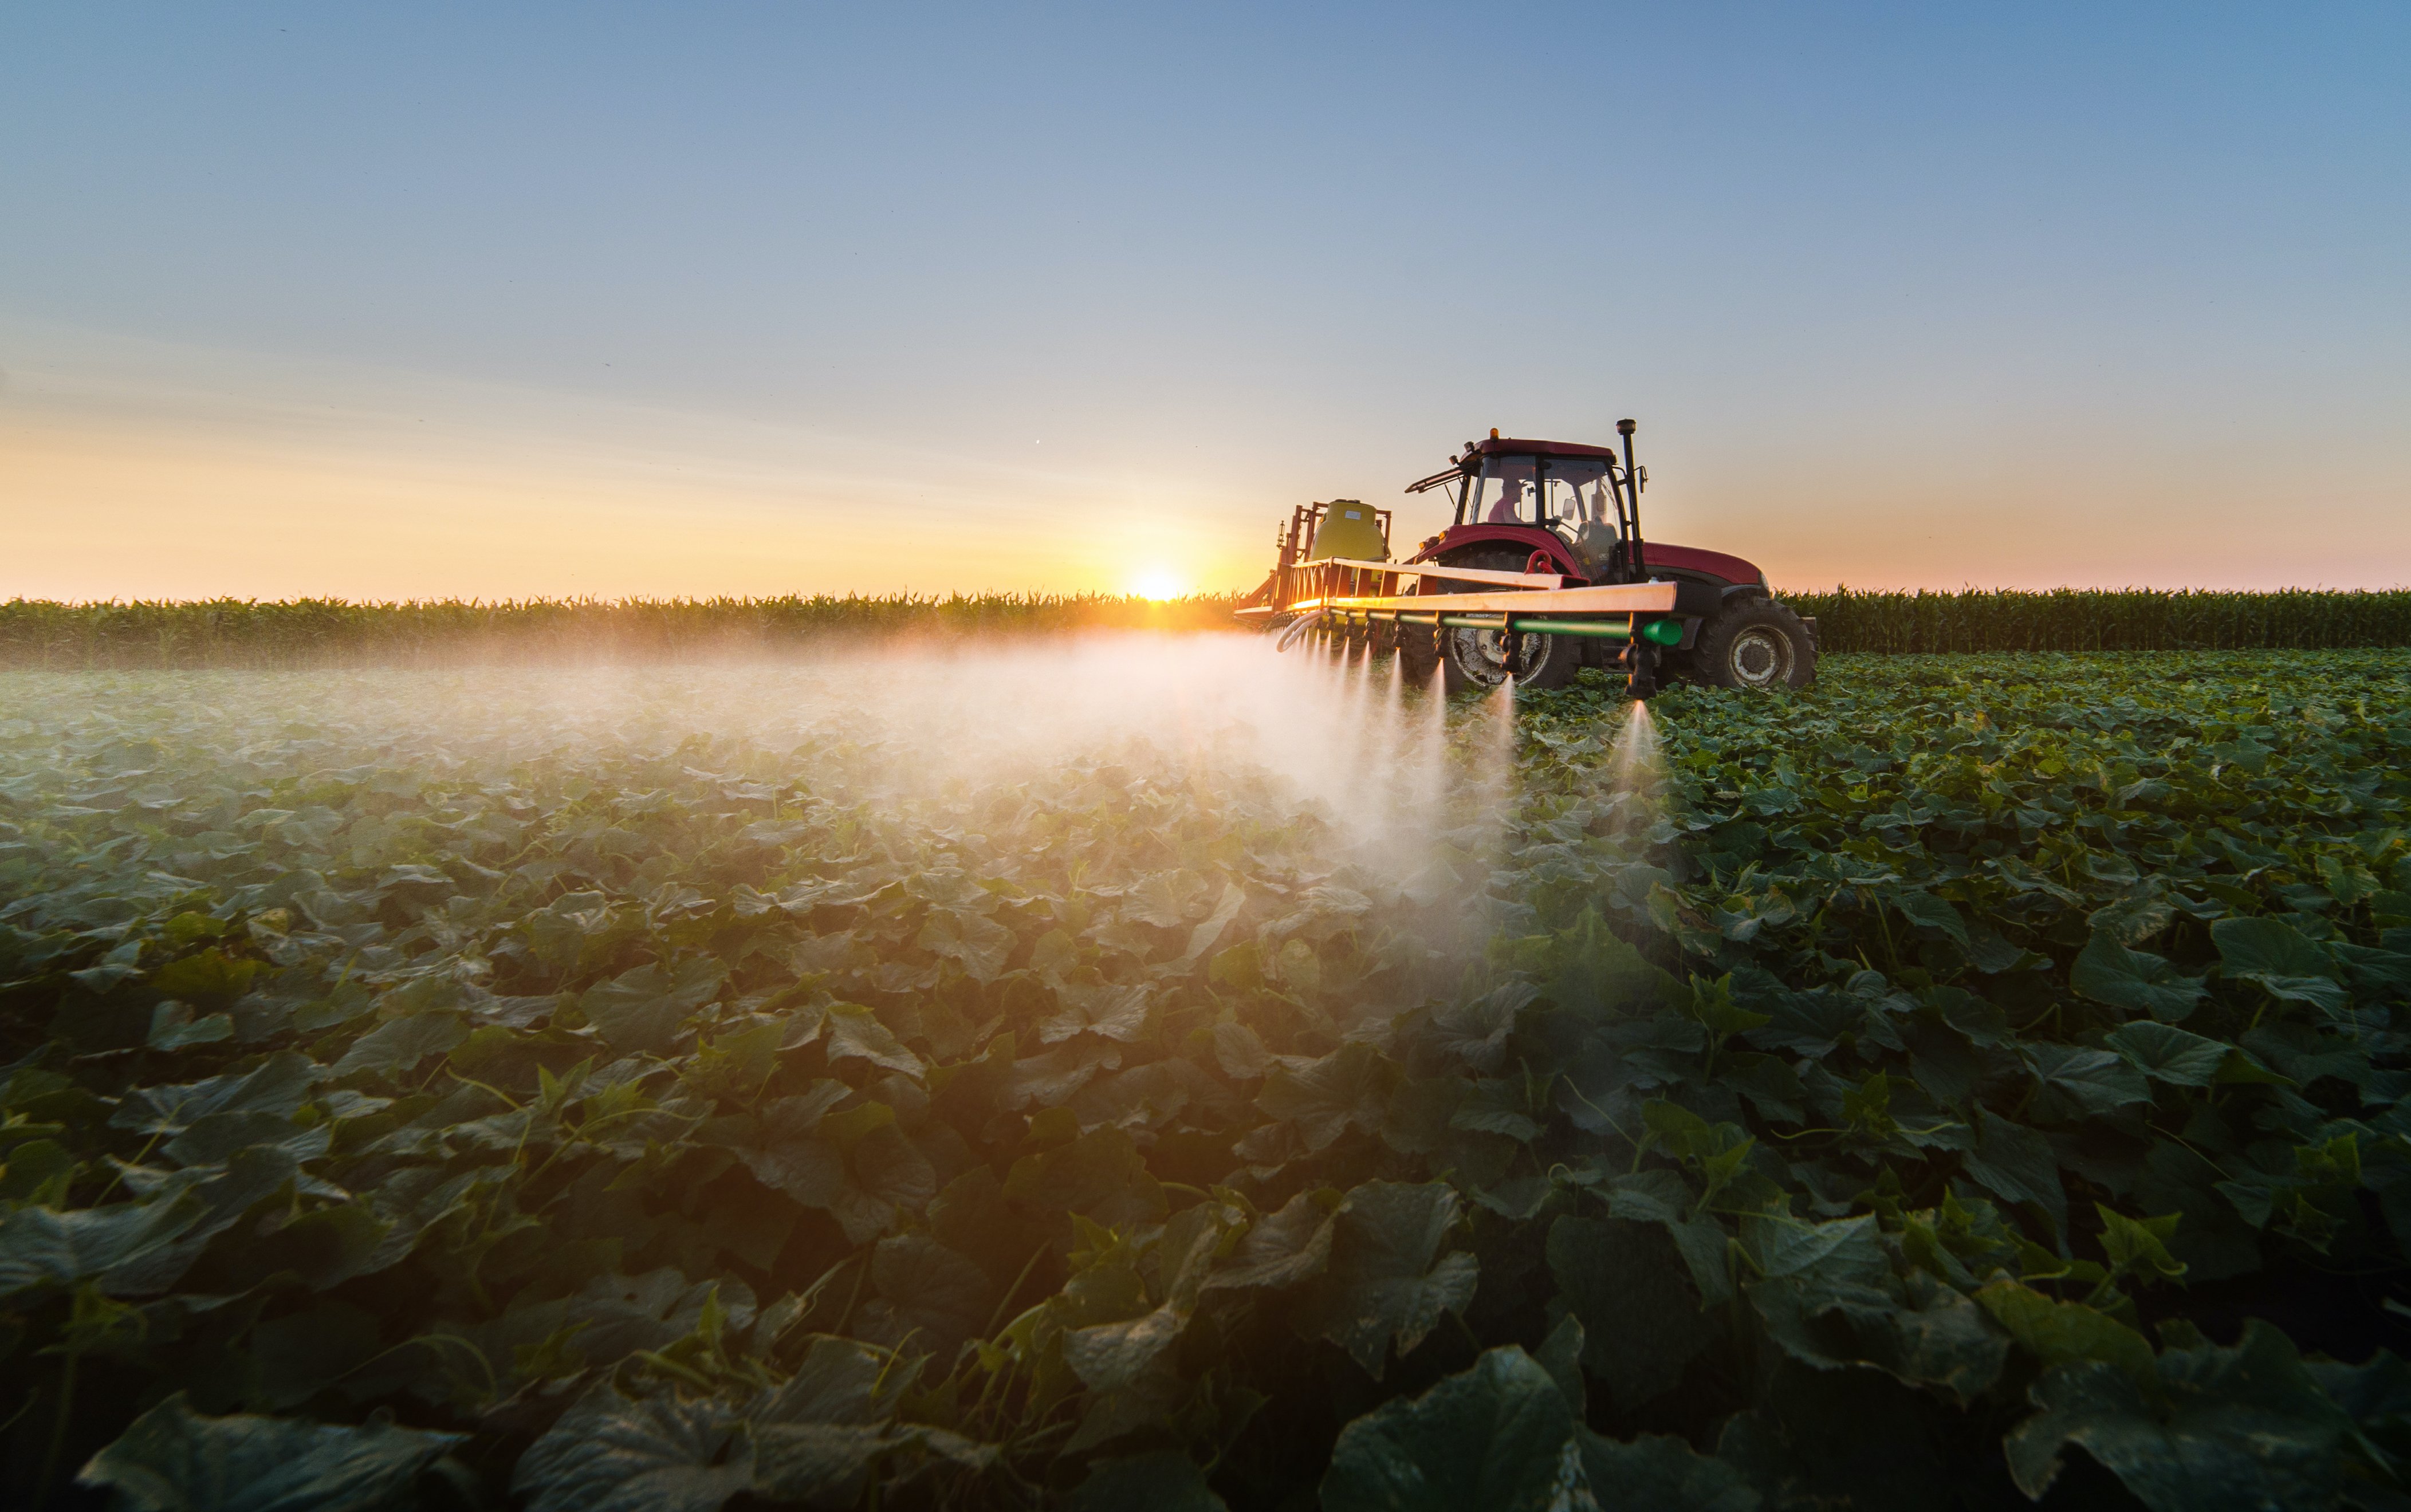
High-resolution multispectral imagery is only the beginning. Our analytics tools help you interpret your data—translating what you can see in your imagery into what you can do about it.
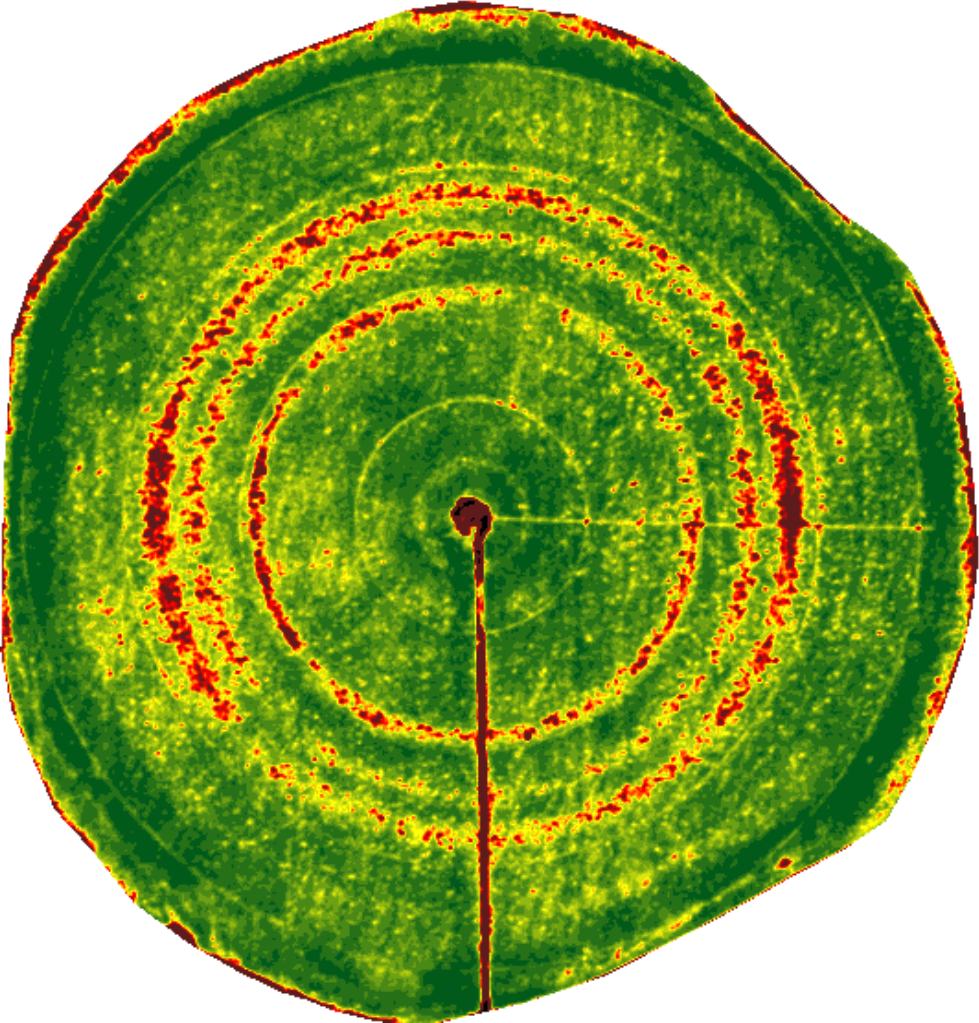
The red rings show where a clogged nozzle has resulted in underwatering.
In this field, stressed areas were found to correspond to areas with an inferior soil type.
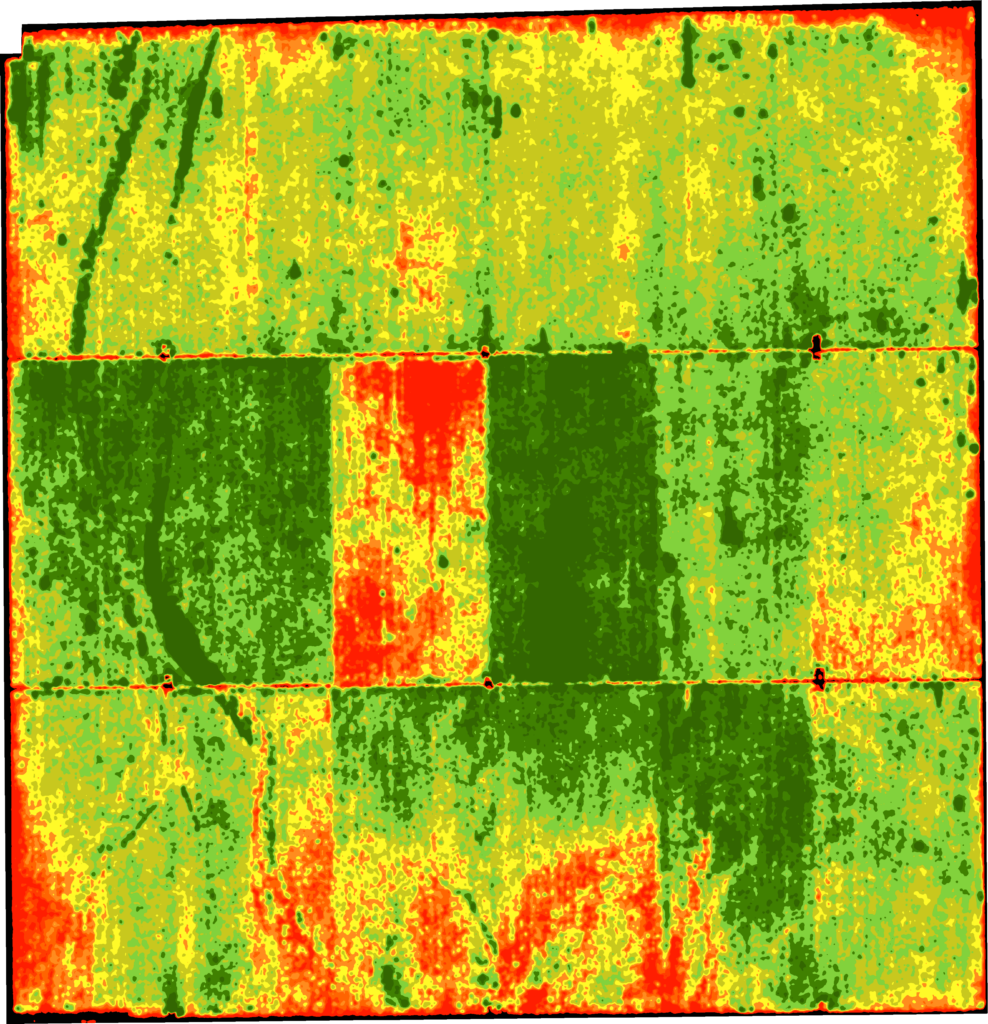
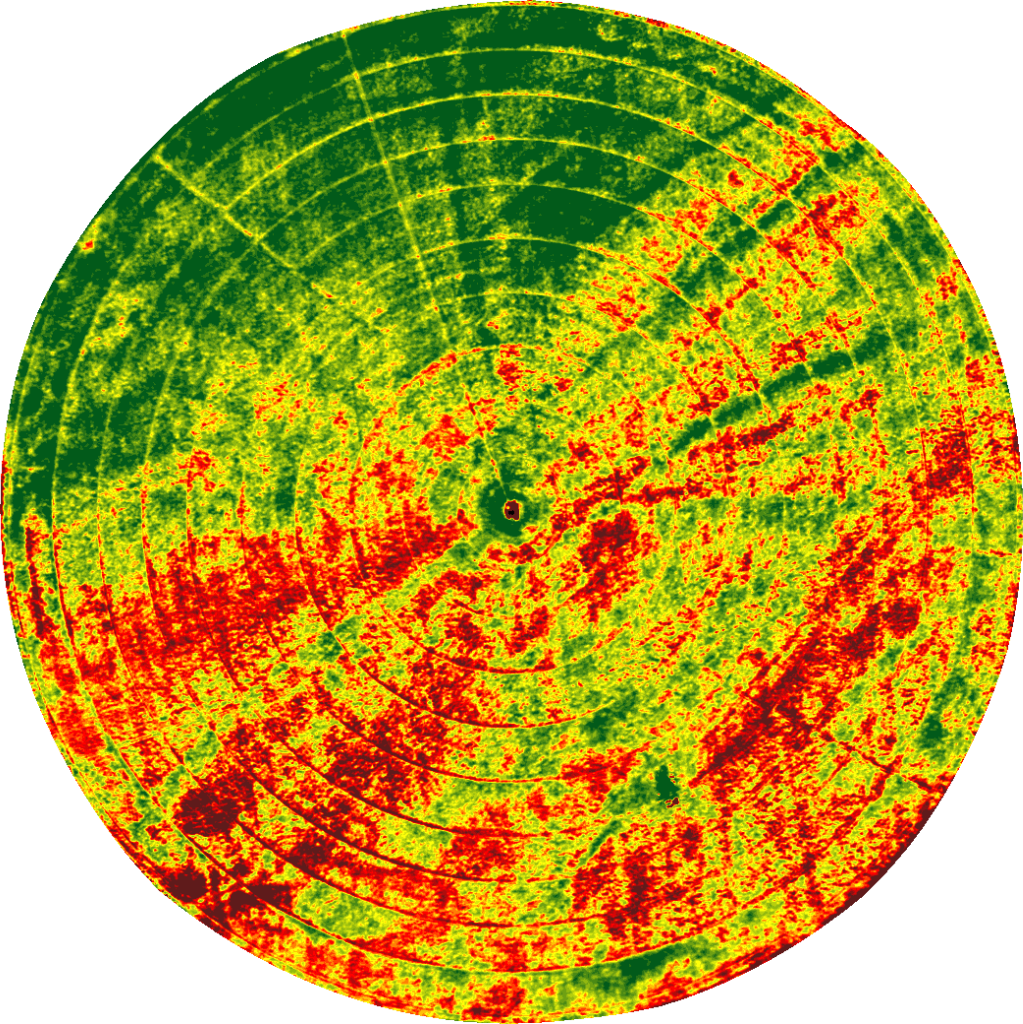
The stressed area in the center of this field was caused by improperly set irrigation regulators.
Damage to drip line in this field resulted in large areas of decreased canopy vigor.
We capture imagery during peak daylight hours and under weather conditions that minimize distortion from shadows and cloud cover. Our highly sensitive, custom-built cameras detect minute changes in the multispectral range—allowing us to detect crop stress earlier than our competitors.
Imagery is geo-referenced and meticulously “masked” to ensure that only relevant information is evaluated. By making use of crop-specific data models and isolating the canopy from ground cover and other background noise, we prevent skewing of the data and enable a more accurate assessment of plant health.
Imagery is assessed in-house by Ceres Imaging’s remote sensing experts, passing through multiple checkpoints before delivery in the Ceres Imaging app within 48 hours of the flight. Growers can access their data on a mobile device, tablet, or desktop computer.
The difference between Ceres Imaging and other technologies I've used is the help I get from their expert team.
With Ceres Imaging we can take a more targeted approach to applying fertilizer and nutrients.
These flights can cover way more ground and provide more insight than a dozen soil moisture probes — and it's cheaper to implement.
The average Ceres Imaging conductance measurement from its imagery over the season has provided the best correlation with applied water.
360 22nd St., Suite 200
Oakland, CA 94612
+1 888-704-9398
support@ceresimaging.net
Landmark Center
1299 Farnam St., Suite 300
Omaha, NE 68102
Bellefield Office Park
1400 112th Ave SE, Suite 100
Bellevue, WA 98004