
OUR SOLUTIONS
Damage reporting
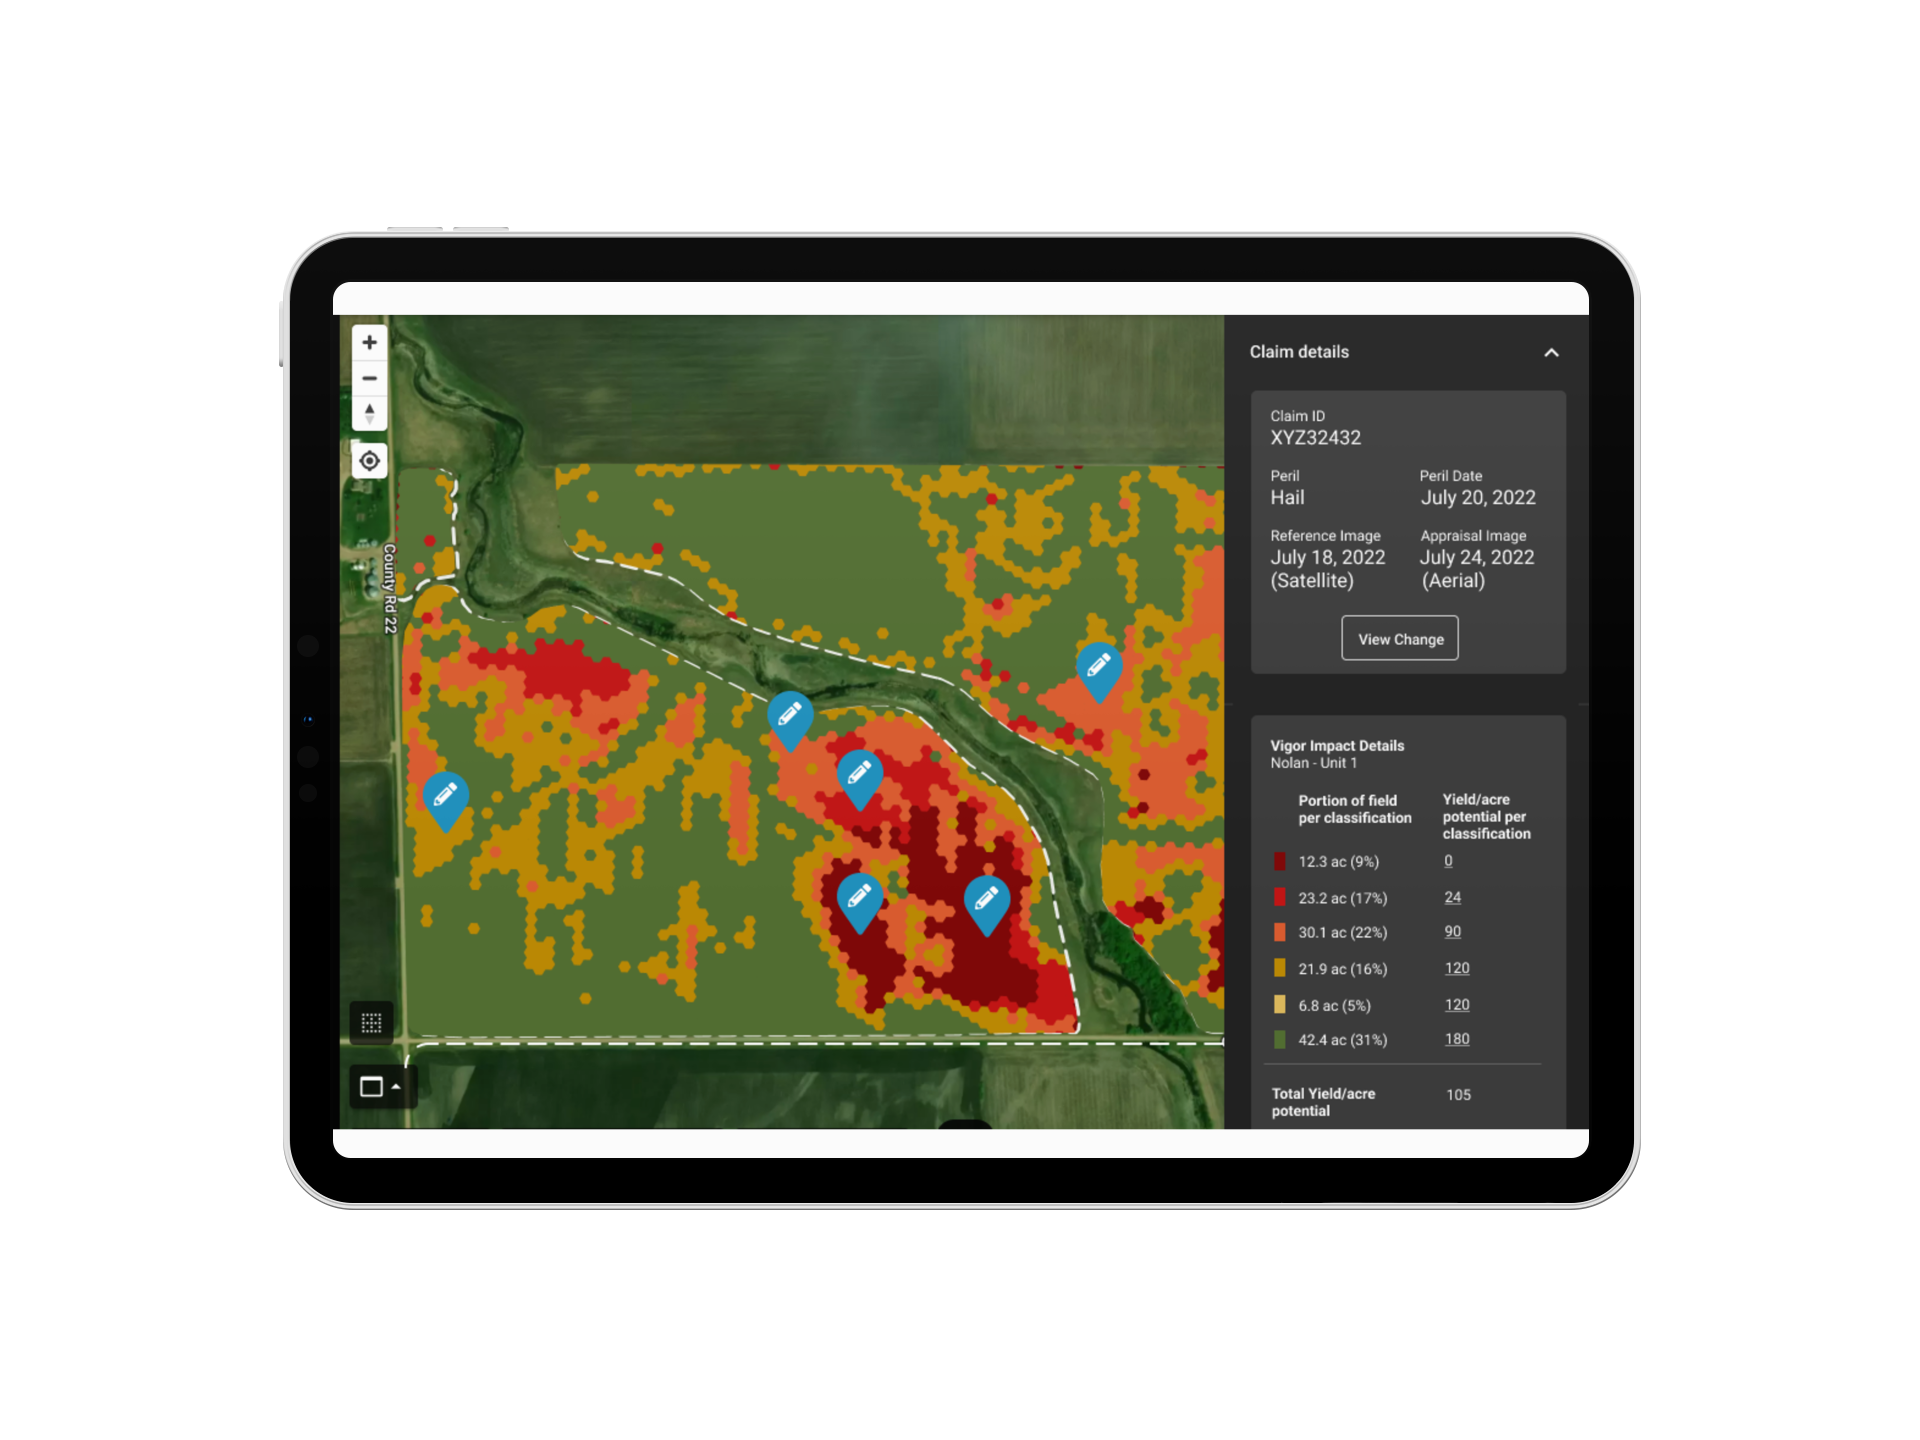
When extreme weather impacts the crop, farmers rely on insurance carriers to respond quickly and fairly in assessing their losses. As climate change increases the frequency and severity of these peril events, insurance carriers must adapt to keep pace. Ceres’ advanced damage reporting offers customizable tools for streamlining the appraisals process, improving accuracy, and strengthening client trust.

Science-backed
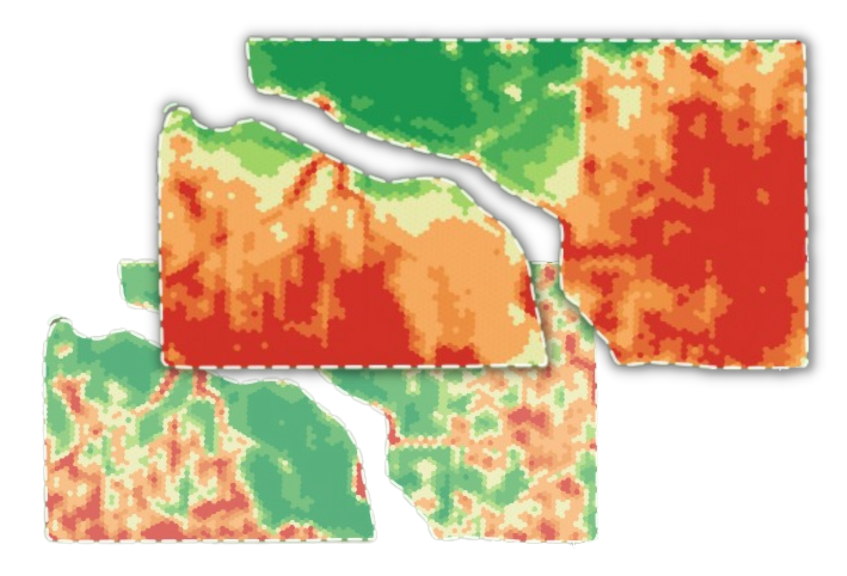
Ceres’ rigorous damage reporting methodology leverages machine learning techniques and a proprietary dataset of more than 11 billion individual plant-level measurements. Learn more and explore a real-world example in this in-depth report.

![]()
