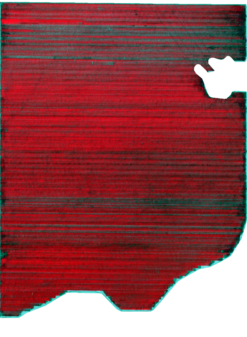
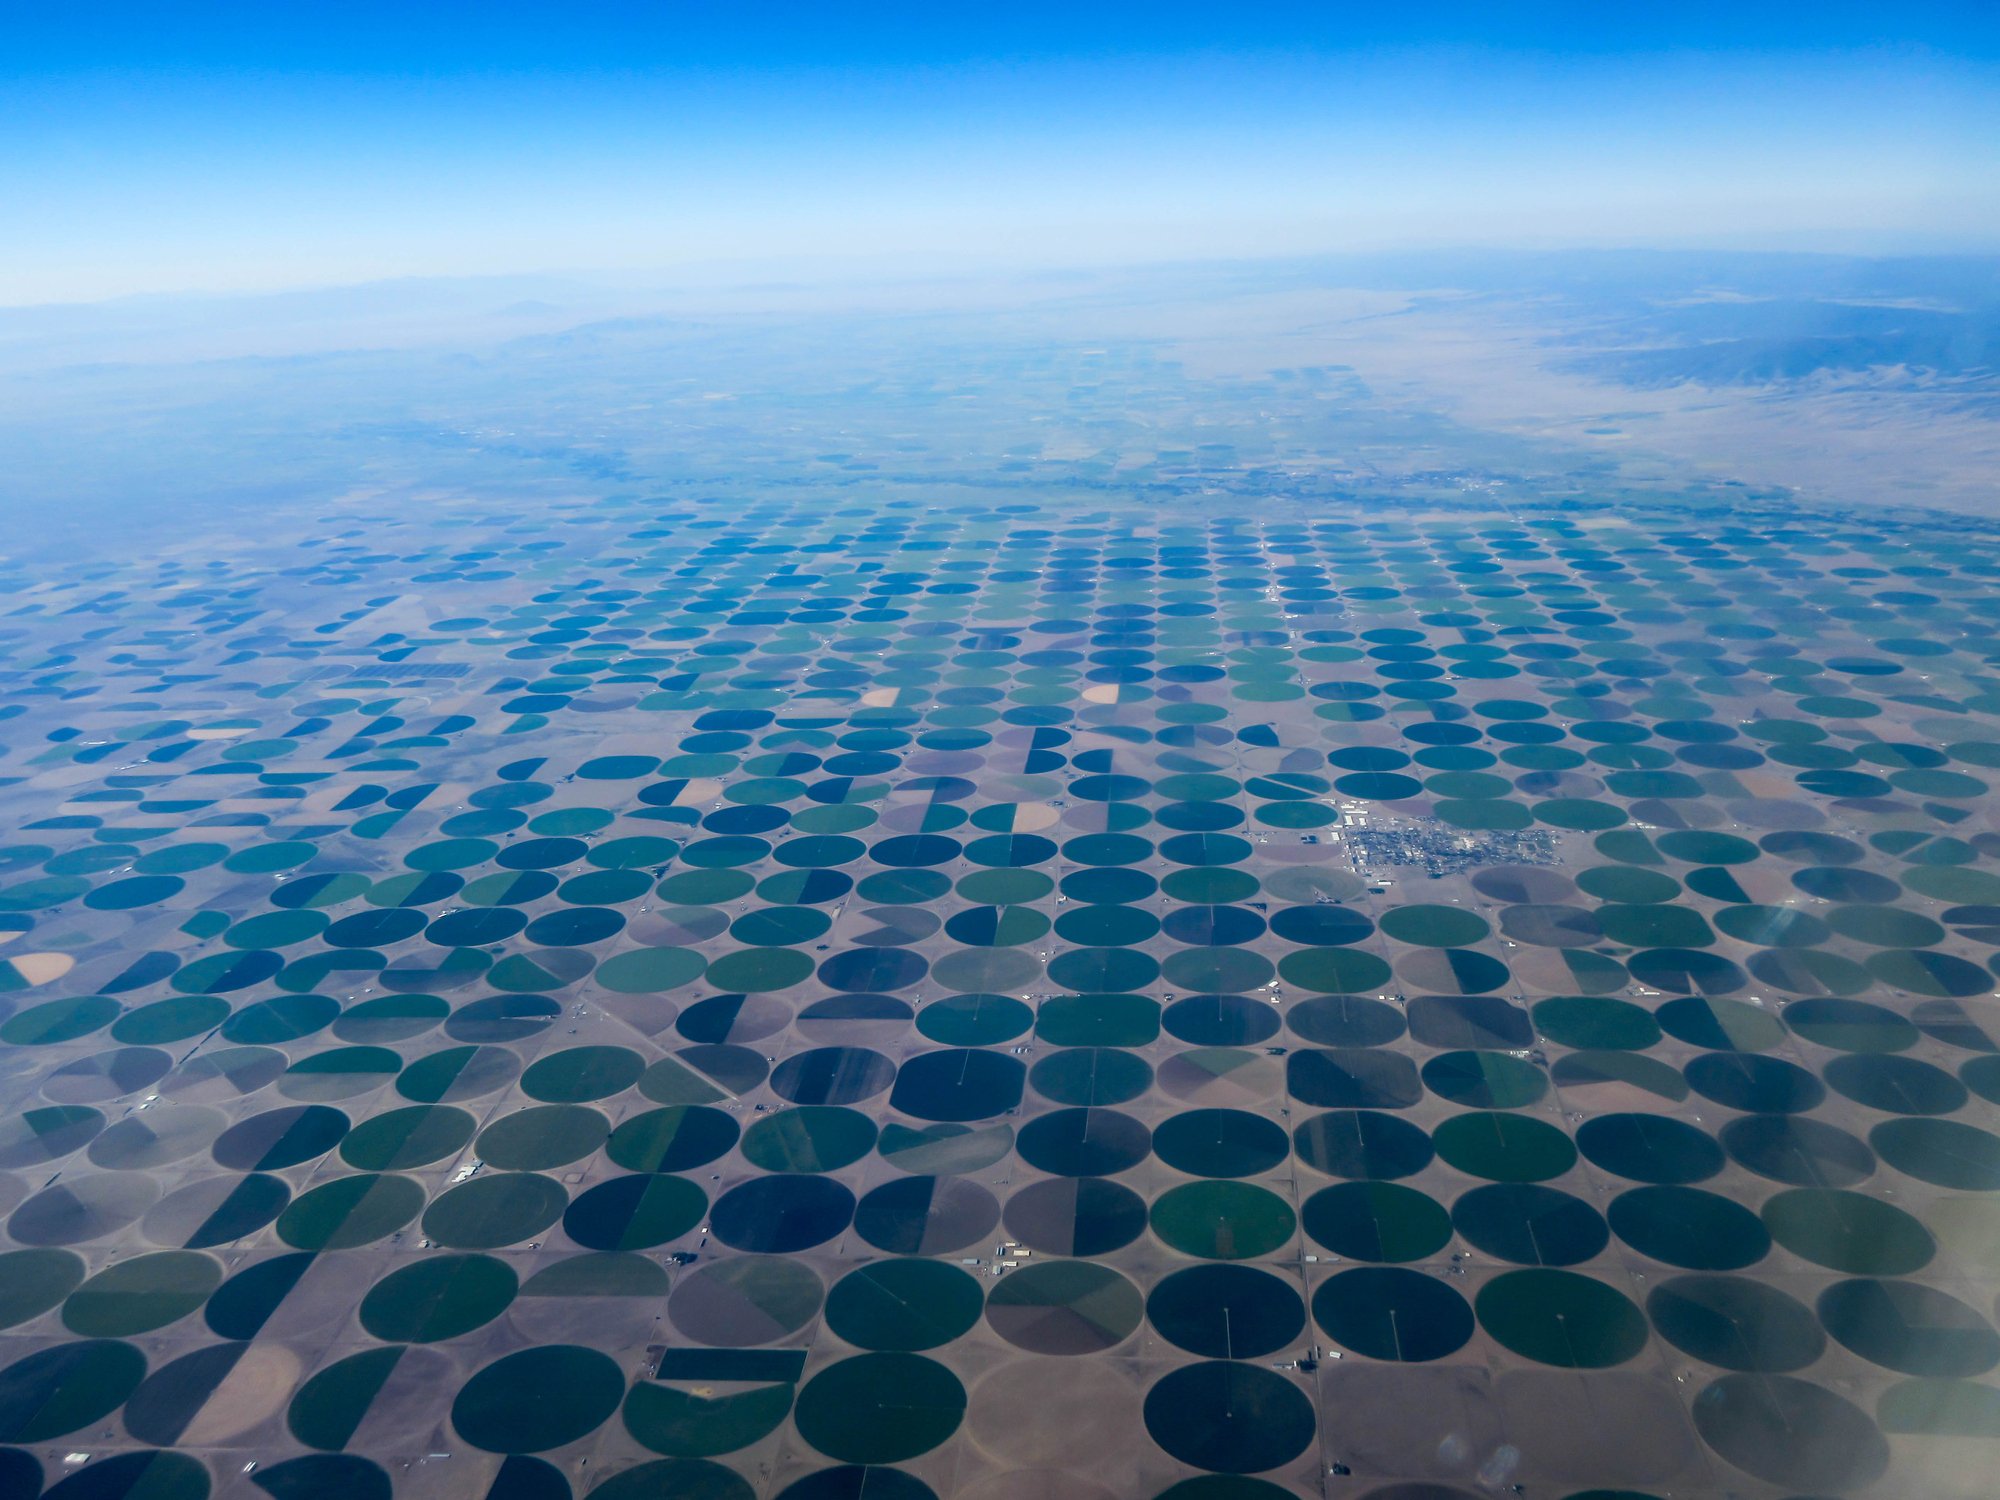
aerial center pivots blue

Common uses

  • Evaluating early-season growth
  • In annual crops, identifying areas of a field that need re-seeding
  • Mapping variations in soil composition
  • Pinpointing irrigation issues prior to planting
  • Generating prescription maps for variable rate applications


bare_soil_blue_sky

How it works

Color Infrared imagery incorporates three spectral bands—red, green and near infrared. CIR is sometimes called a “false color” image, because of the bright red color characterization that occurs when healthy plants reflect the near infrared wavelengths. Other colors in the imagery represent different concentrations of moisture and organic matter. 

CIR imagery offers growers a comprehensive first look at a recently planted field by revealing which areas of a field experience the first plant emergence, as well as the uniformity of that initial growth. On bare ground, CIR imagery also offers a quick and cost-effective method of soil mapping.

In humid summer months, CIR imagery is more effective than RGB imagery at displaying detail in hazy conditions. Variable rate zones generated from CIR imagery create opportunities for prescription mapping for herbicides, pesticides, and soil amendments throughout the season.

From imagery
to action

High-resolution multispectral imagery is only the beginning. Our analytics tools help you interpret your data—translating what you can see in your imagery into what you can do about it.
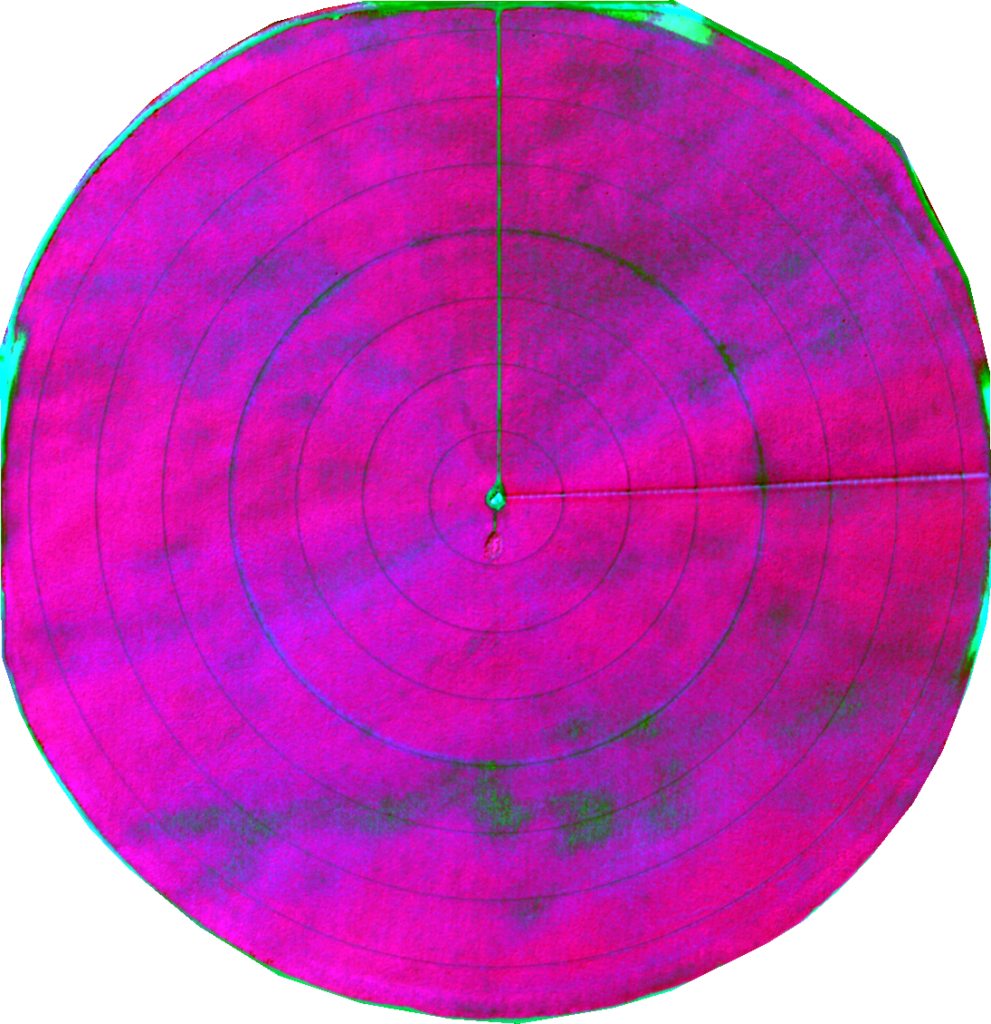
color infrared irrigation system

Irrigation systems

Color infrared imagery can be used to evaluate irrigation systems prior to planting.

Irrigation issue color Infrared

Soil mapping

Soil zones built from color infrared imagery are a cost-effective alternative to grid mapping and EC/EM mapping.
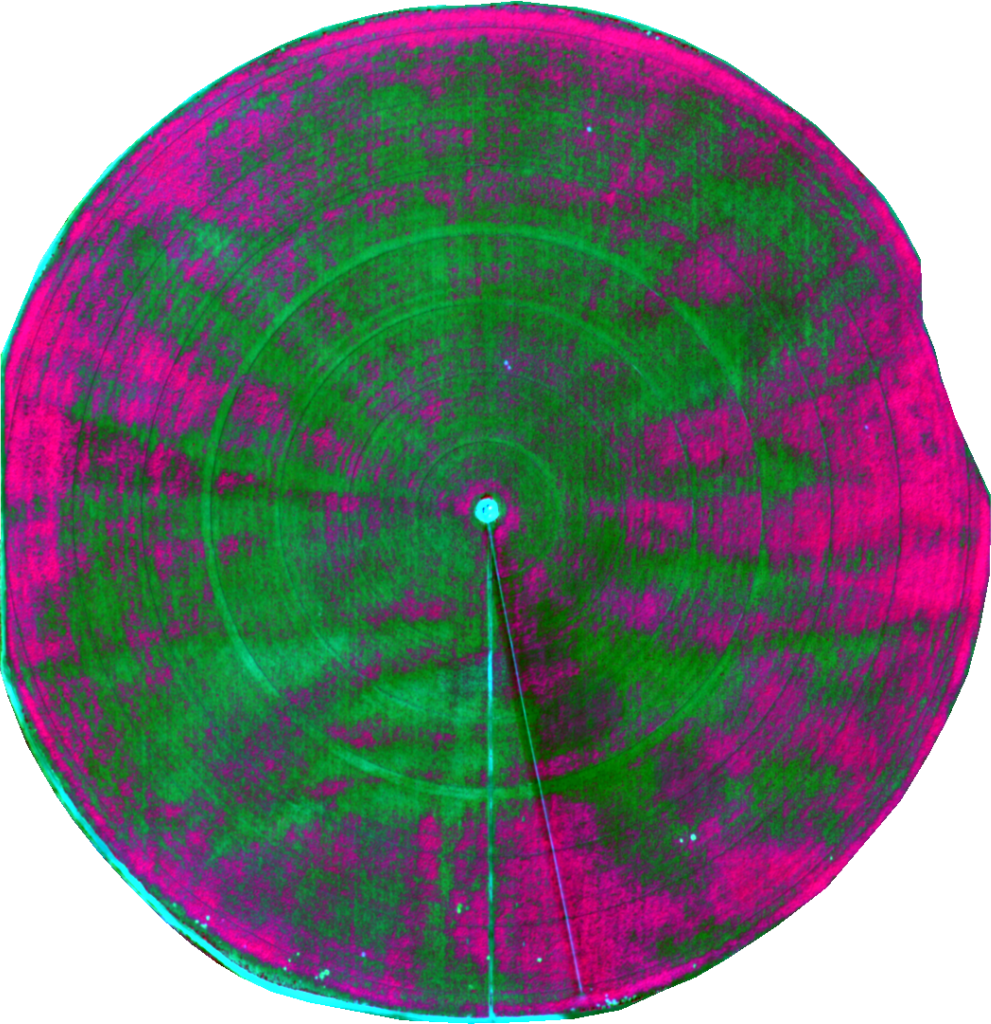
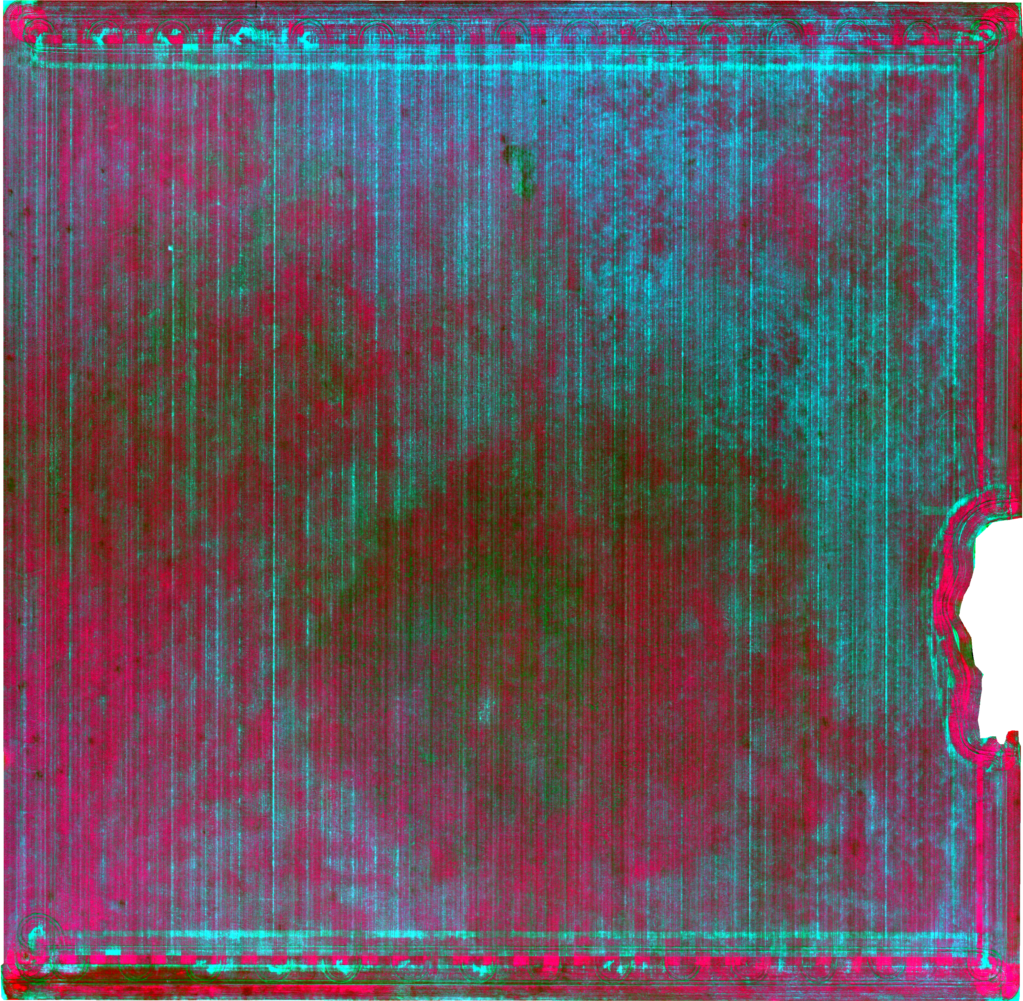
drip irrigation color infrared

Issue detection

Linear patterns in this color infrared image correspond to damaged drip line in the field.

color infrared detail

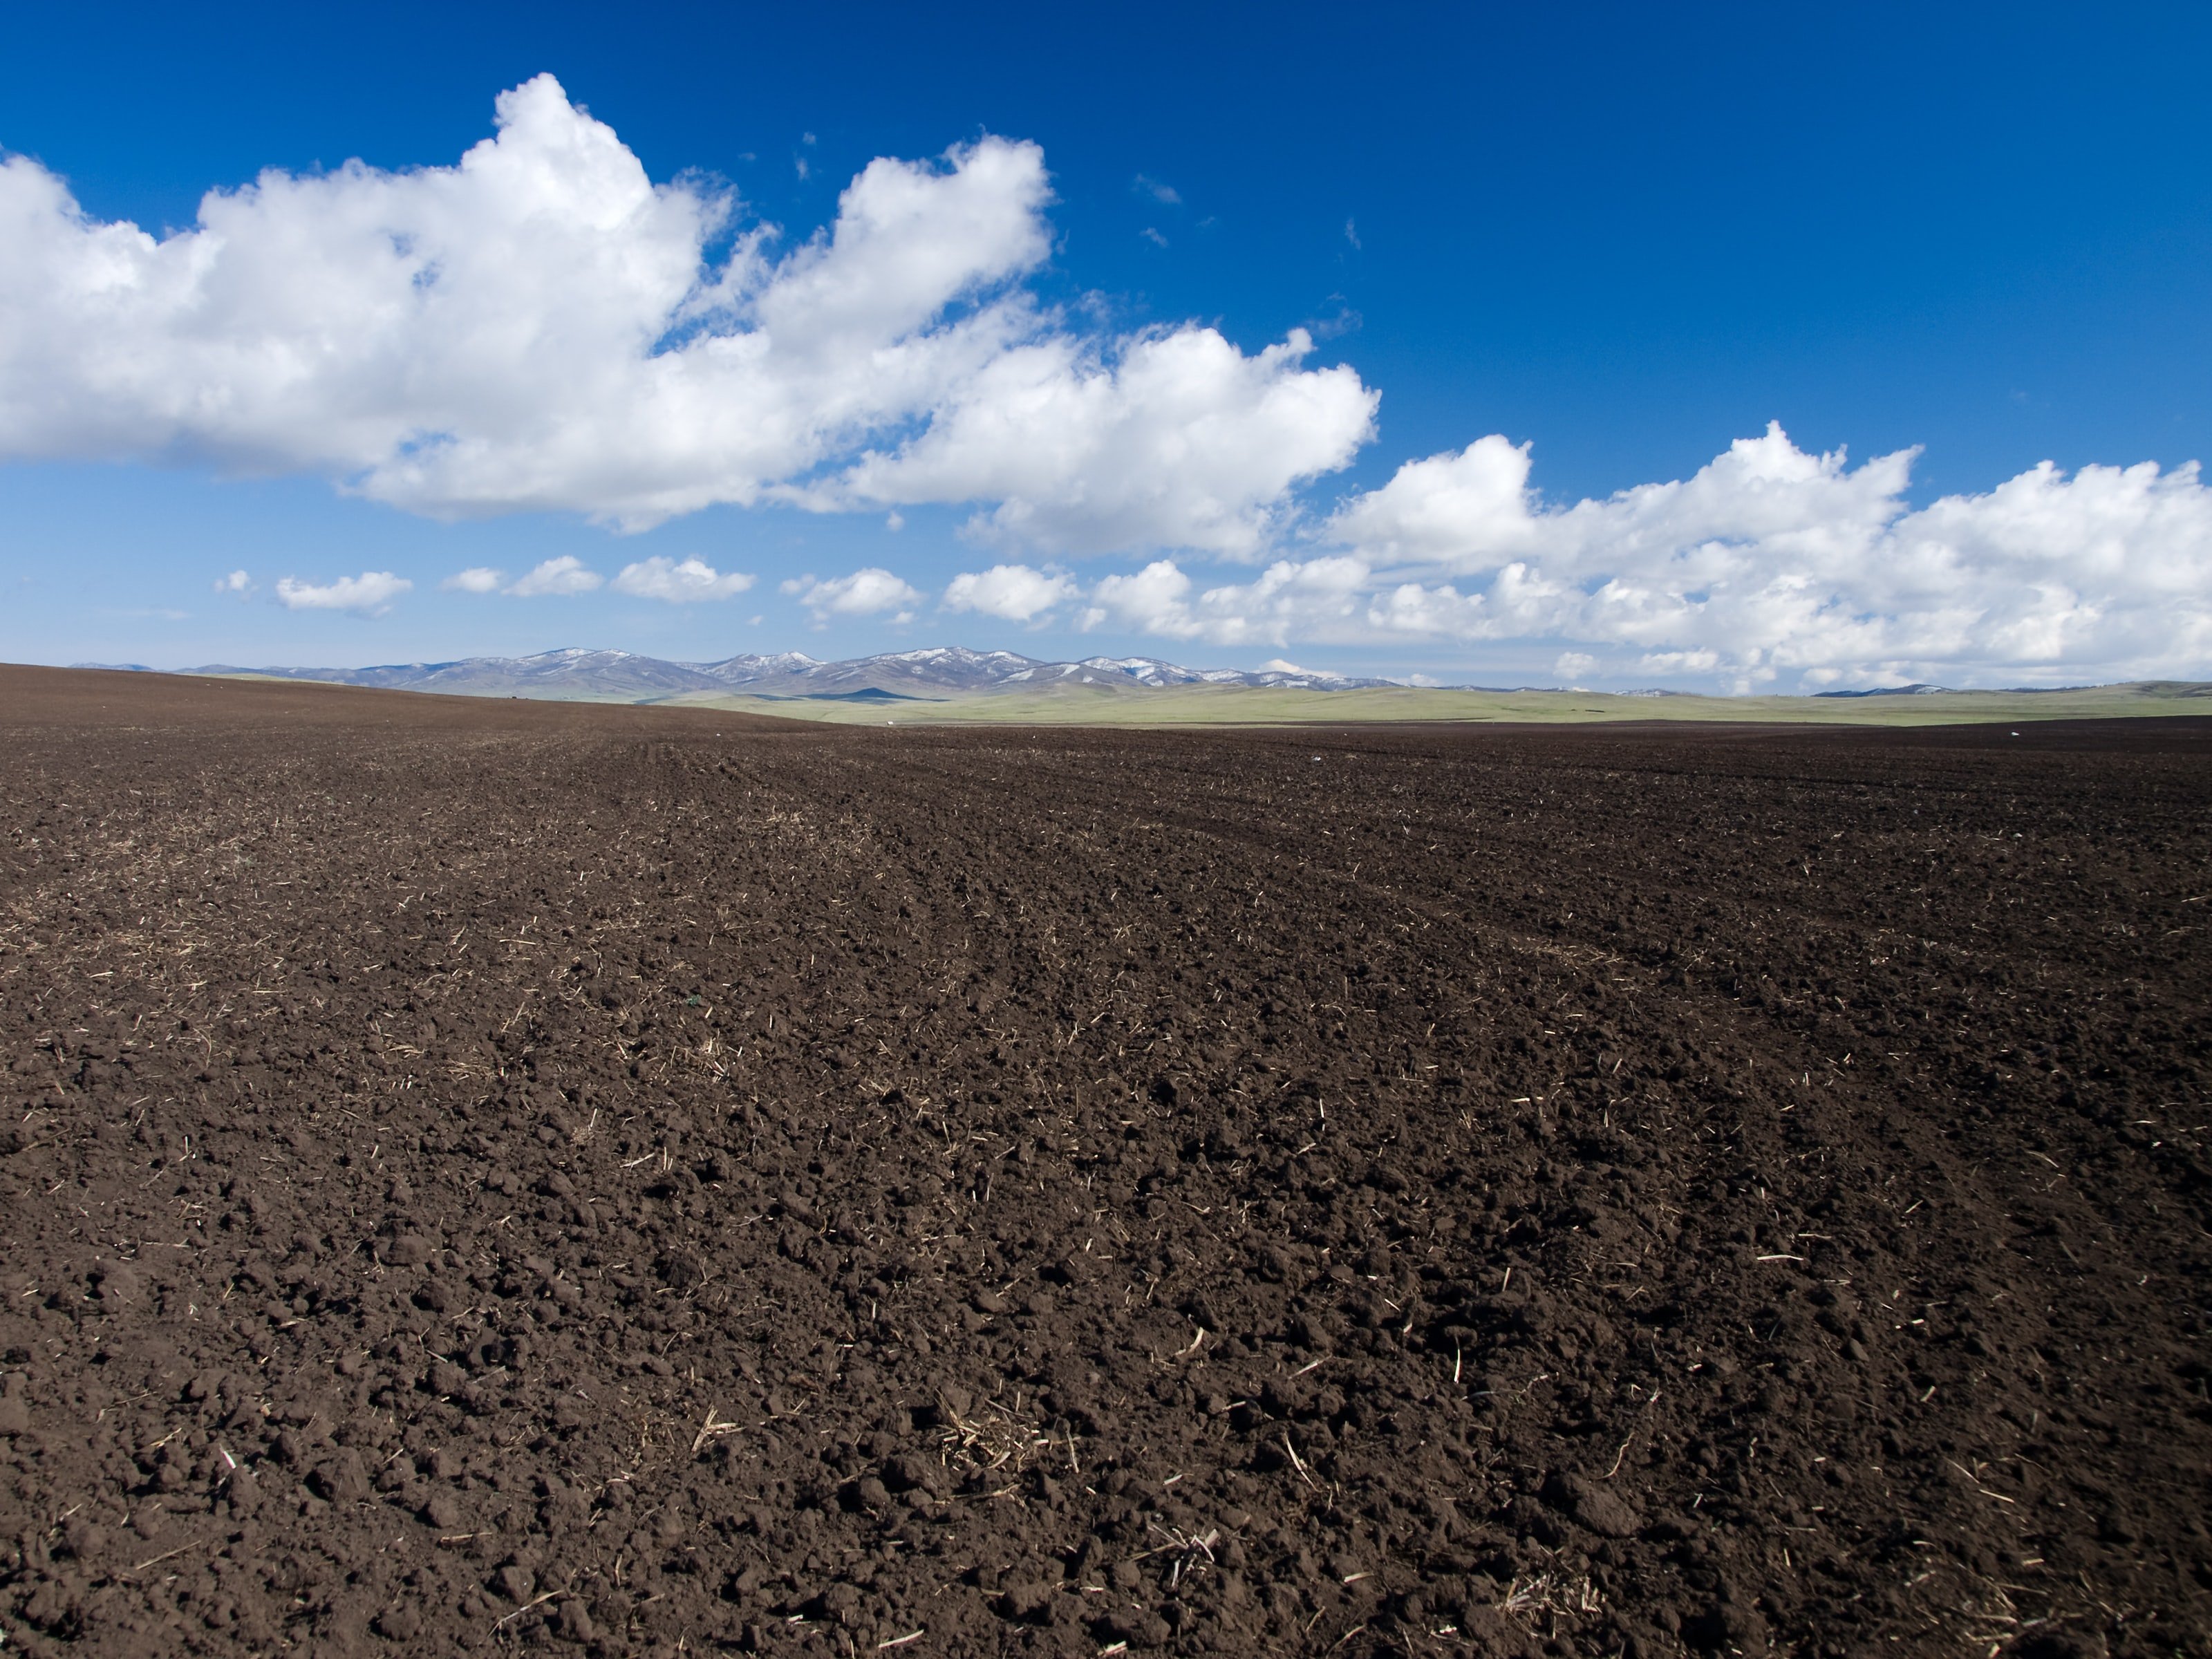
Early-season monitoring

Color infrared imagery is especially useful for evaluating conditions in the field when crop canopy is minimal.

Ensuring accuracy

Ceres Imaging’s emphasis on quality begins even before we fly your fields.

Image capture

We capture imagery during peak daylight hours and under weather conditions that minimize distortion from shadows and cloud cover. Our highly sensitive, custom-built cameras detect minute changes in the multispectral range—allowing us to detect crop stress earlier than our competitors.

Processing and analysis

Imagery is geo-referenced and meticulously “masked” to ensure that only relevant information is evaluated. By making use of crop-specific data models and isolating the canopy from ground cover and other background noise, we prevent skewing of the data and enable a more accurate assessment of plant health.

Quality control

Imagery is assessed in-house by Ceres Imaging’s remote sensing experts, passing through multiple checkpoints before delivery in the Ceres Imaging app within 48 hours of the flight. Growers can access their data on a mobile device, tablet, or desktop computer.

Icon

Get started with Ceres

Schedule a consultation for detailed product info, pricing, and more.

Contact us
The difference between Ceres Imaging and other technologies I've used is the help I get from their expert team.
Jake Samuel, Partner
Samuel Farms
With Ceres Imaging we can take a more targeted approach to applying fertilizer and nutrients.
Brian Fiscalini, Owner
Fiscalini Cheese Company
These flights can cover way more ground and provide more insight than a dozen soil moisture probes — and it's cheaper to implement.
Patrick Pinkard, Assistant Manager
Terranova Ranch
The average Ceres Imaging conductance measurement from its imagery over the season has provided the best correlation with applied water.
Blake Sanden
University of California Cooperative Extension