
OUR SOLUTIONS
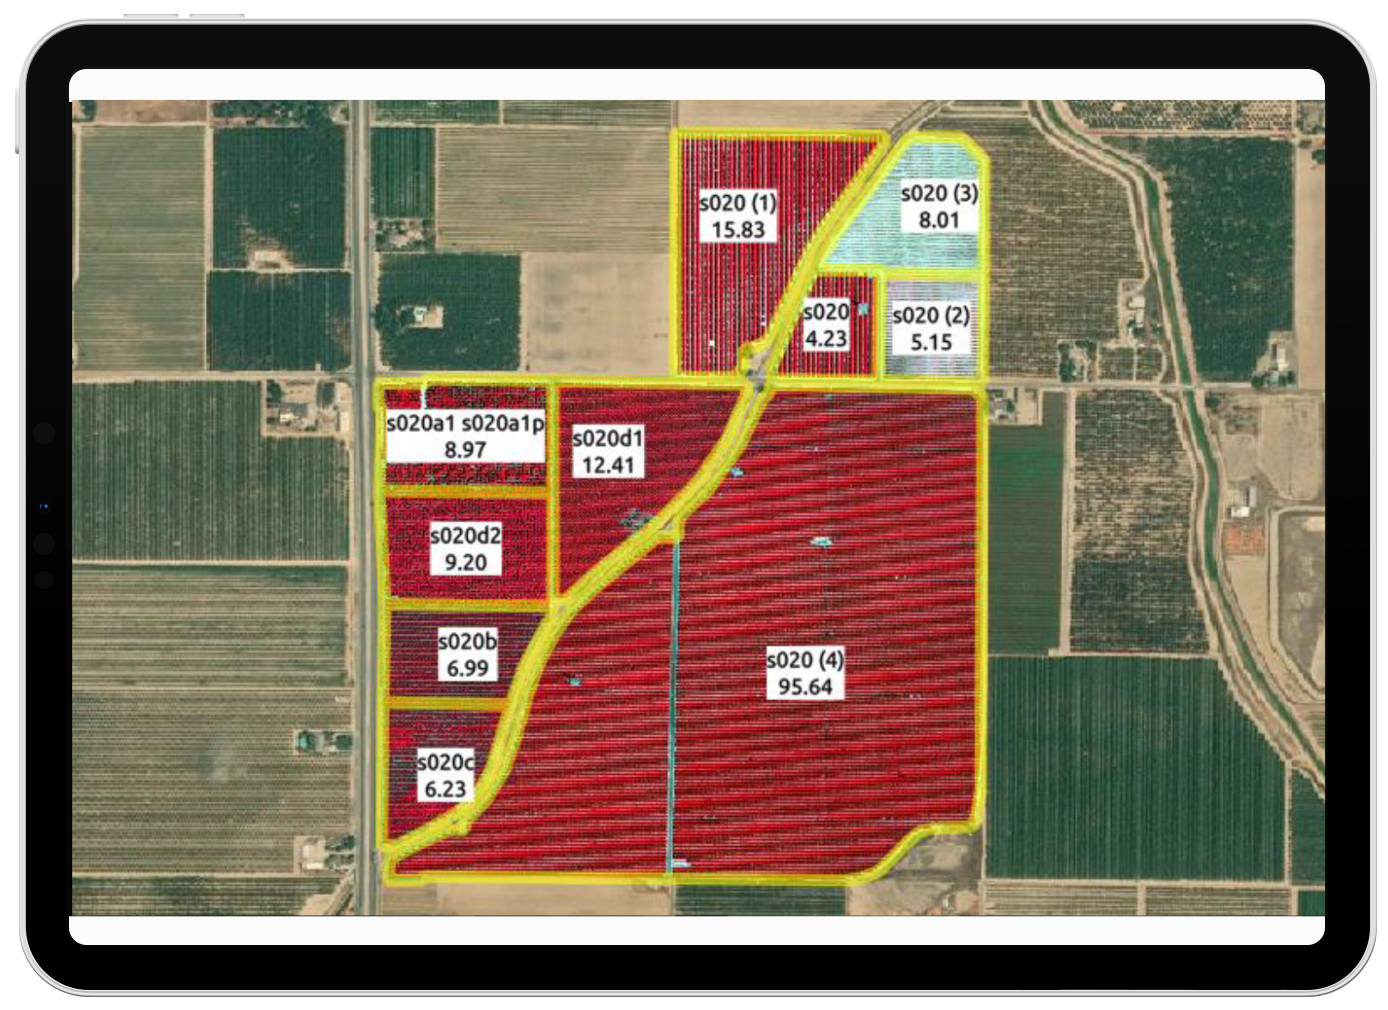
Crop inventories
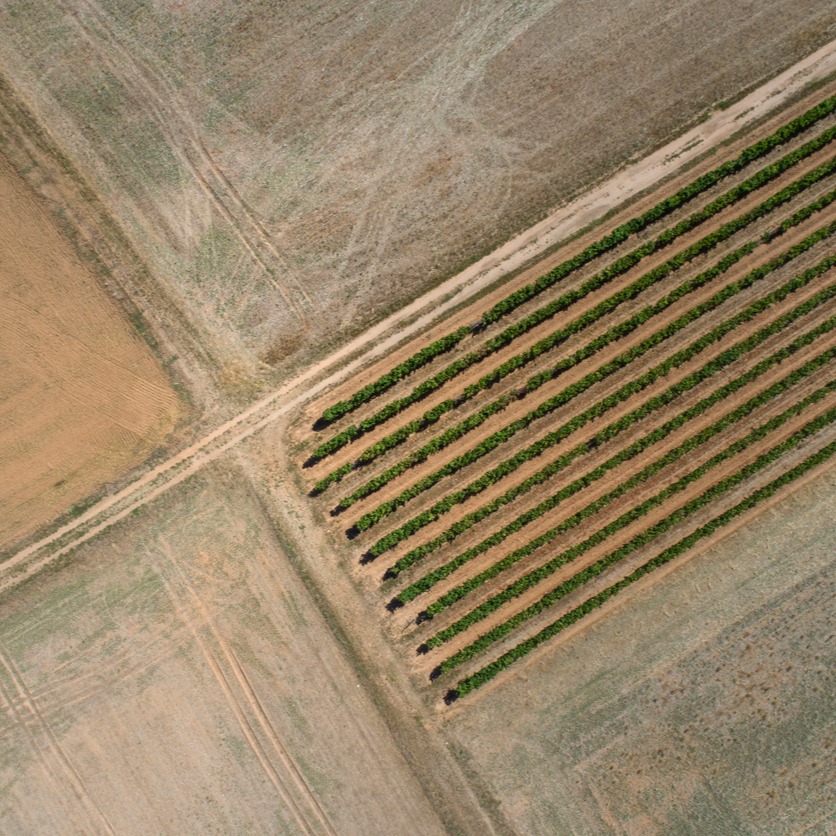
An accurate measure of agricultural lands’ actual crop area is essential to growers and their partners, from insurers to investors—but traditional methods of inventorying crops are labor-intensive and difficult to scale. Ceres’ remote-sensing-based alternative makes it possible to assess and manage global portfolios with ease.

![]()
