
Cumulative Stress Index
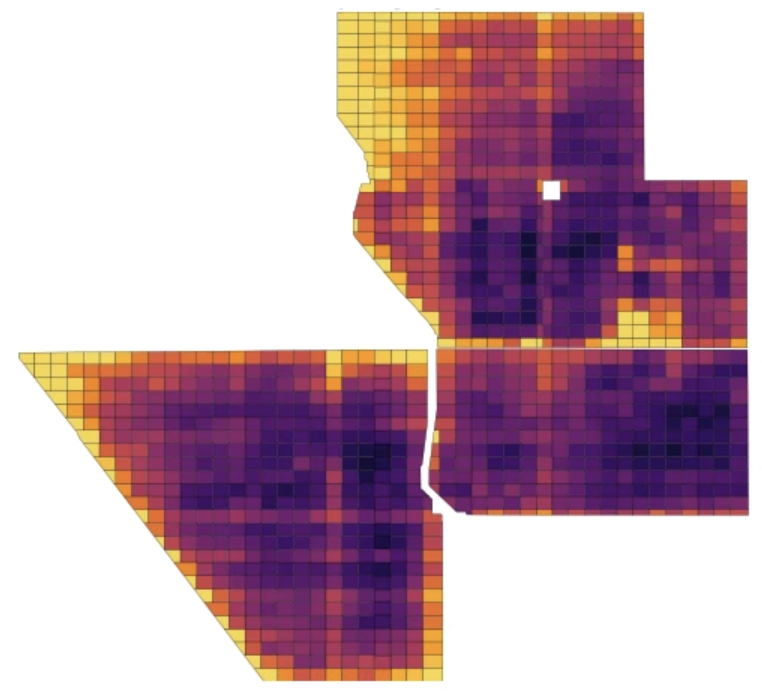
The Cumulative Stress Index is a scorecard of total orchard health, revealing where yield may be most impacted by stress. Use the index to identify the most vulnerable areas of your operation, evaluate the ROI on addressing issues, and protect the long-term health of your business.

From imagery to action
A four-year study with the University of California found that a 20% cumulative stress score corresponded with an 11% reduction in yields each year on average.

Quantify the impacts of persistent stress
Dark purple represents the least stressed areas, while yellow areas are the most stressed. Each successive color on the scale corresponds to a 7%–8% increase in cumulative stress.
The Cumulative Stress Index can be delivered mapped to an acre-grid or to customized irrigation zones.
![]()
