
Recent upgrades to the Cumulative Stress Index provide Ceres Imaging customers with a powerful tool for optimizing irrigation strategy, forecasting yields, and measuring ROI on orchard investments.
But these changes didn't happen overnight. Like other advances at Ceres Imaging, they're the product of extensive research by our in-house team of remote sensing scientists. We caught up with Analytics Team Lead Dan Urban to learn more about the work behind the Cumulative Stress Index.
What's your role at Ceres Imaging—and what do you enjoy most about it?
I’m the analytics team lead within the science group, which means I get to work with a remarkable group of people who develop methods to turn visual patterns in our imagery into metrics.
For example, you might glance at our water stress imagery and see that some parts of a field are more stressed than others. But by how much? And how is that changing over time? Those are the kinds of questions we try to get at. Helping add value to our customers in that way gets me excited to be part of Ceres Imaging.
Tell us about the research collaboration that led to the Cumulative Stress Index.
There have been many growers and farms that we’ve learned from in developing this product, but definitely the most important collaboration has been with Blake Sanden and his colleagues the UC Cooperative Extension’s almond irrigation trial, which we were involved with from 2014 to 2017.
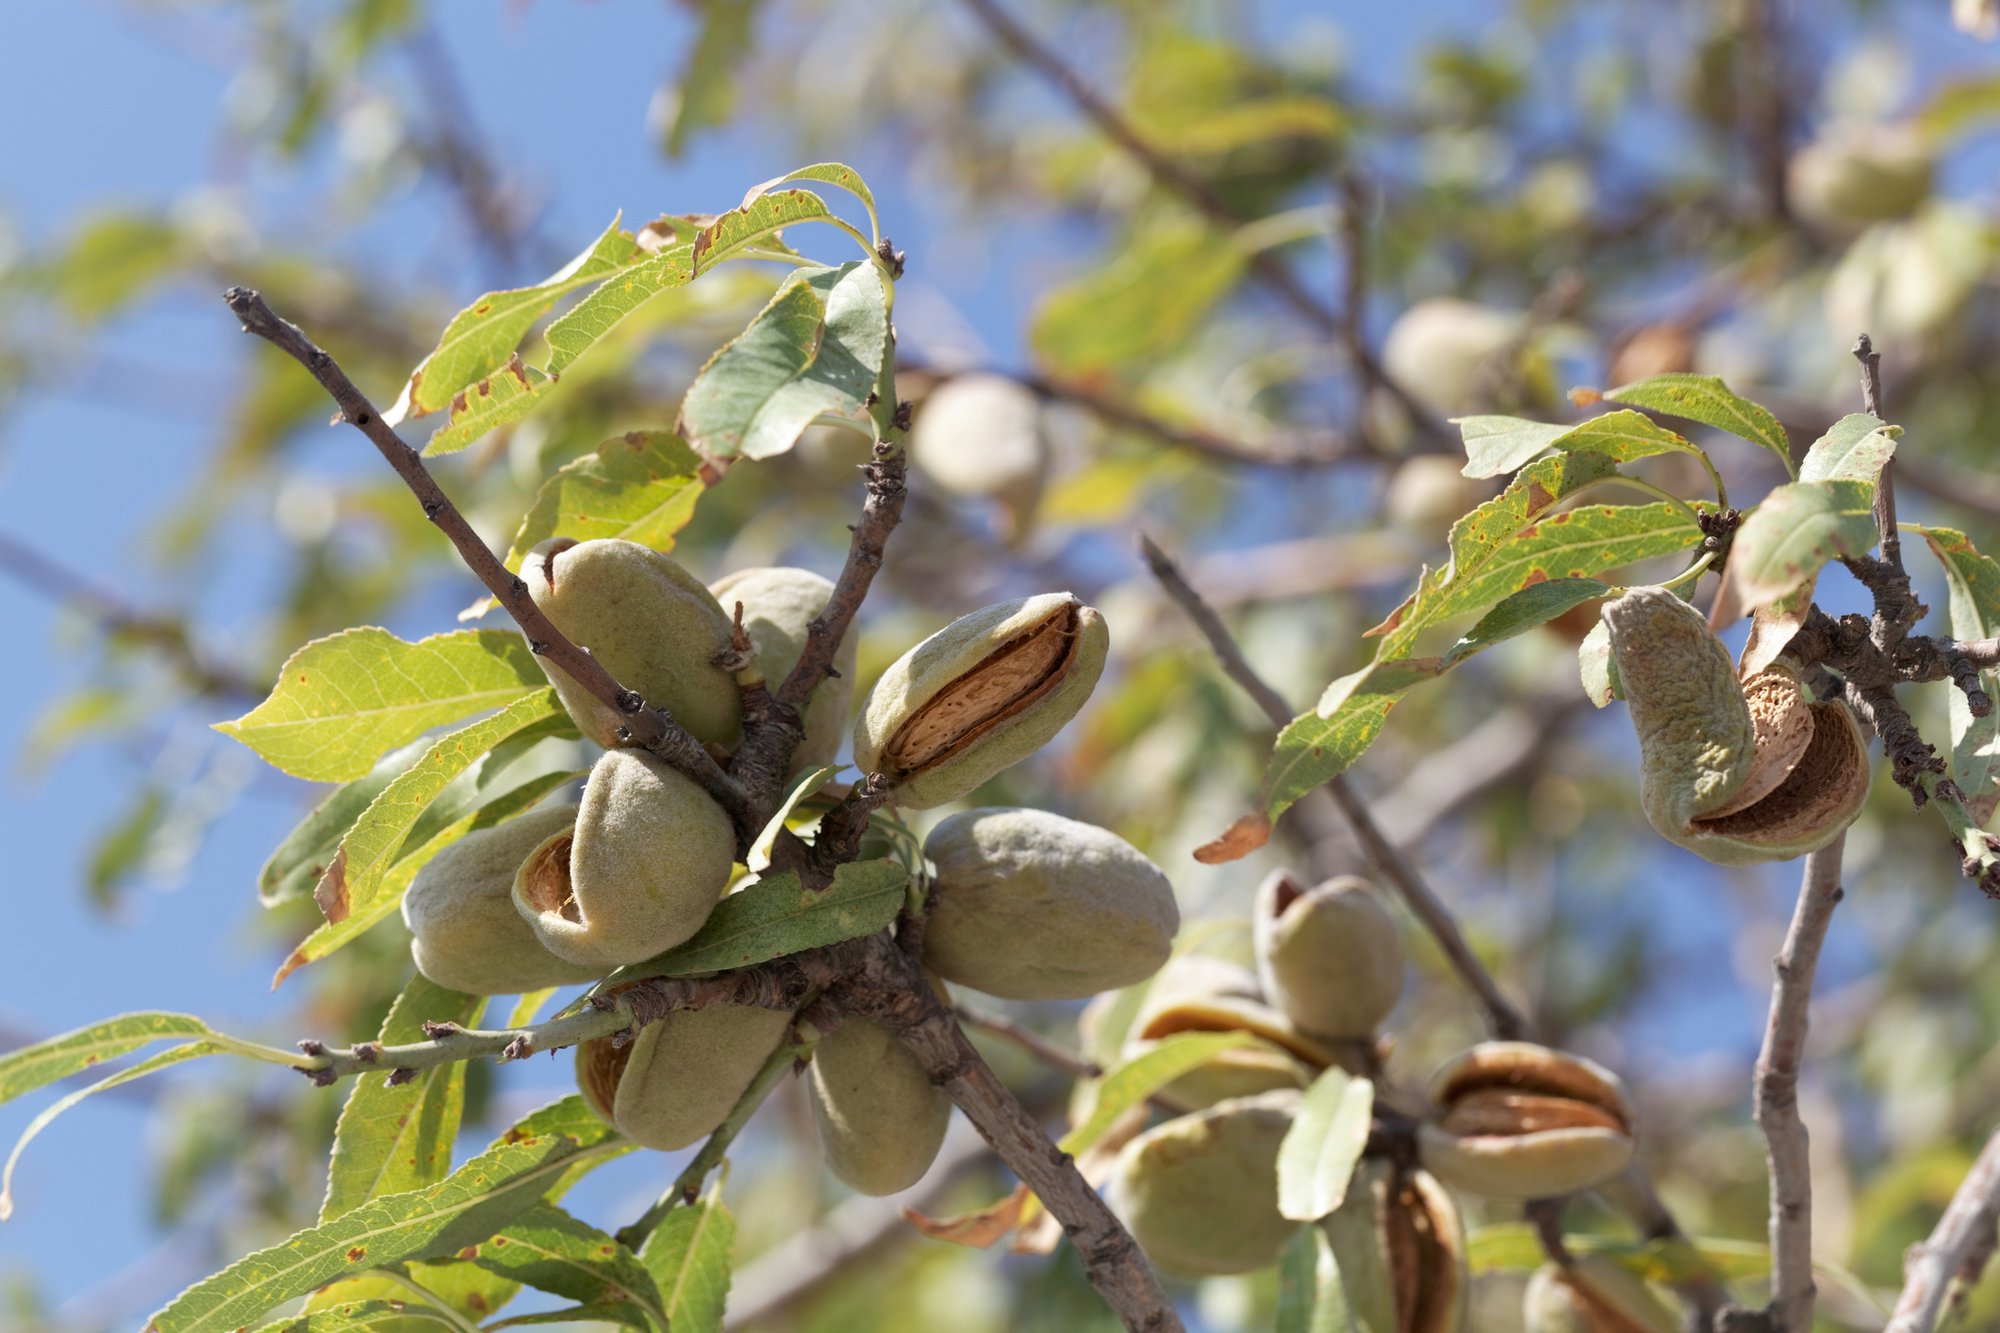
In short, about 100 independently managed one-acre blocks were separately irrigated at one of five irrigation levels, ranging from 70% to 110% of full evapotranspiration (ET). Our aerial imagery allowed us to see the canopy temperature response to different irrigation levels over multiple seasons, and at different points within each season.
What were you trying to find out, and how did you go about it?
Among other aspects of the study, we were interested in whether—and how—we could map thermal measurements of canopy temperature taken from the air to stem water potential, actual applied water, and yield.
Fitting those relationships was done mostly with linear regression, but a big methodological challenge was condensing millions of pixels of thermal imagery information into terms that could be used in such a regression. We had to find ways to get our best estimate of an average tree canopy temperature for each tree and in each flight. We could then aggregate all the trees within a single irrigation zone to a summary value for that zone, and compare those summary values to the known applied water and yield in the zone.
What were your key findings?
The physiological principle that tree canopies should be cooler when they’re less stressed because they can transpire more, and vice versa, was absolutely borne out in practice, and at a scale that we could successfully measure. Canopy temperature differences from our aerial imagery readily identified which blocks were receiving more water and which were receiving less. In fact, this correlation was better than that of stem water potential to applied water.
Was this in line with what you had hypothesized, or were there aspects of the results that surprised you?
Our findings were very much in line with the general principles in existing literature, but most of the research investigating the use of thermal imagery in measuring crop water status had been done over much smaller areas than this, and it wasn’t obvious at the outset how well it would scale. I think we were surprised at how just a handful of snapshots over the course of the season could say so much about irrigation differences throughout a field of commercial size.
What are the implications for growers looking to optimize yields?
While many different factors affect yield, consistently under–or over-irrigating over the course of a season—or worse, multiple seasons—clearly has a negative yield impact.
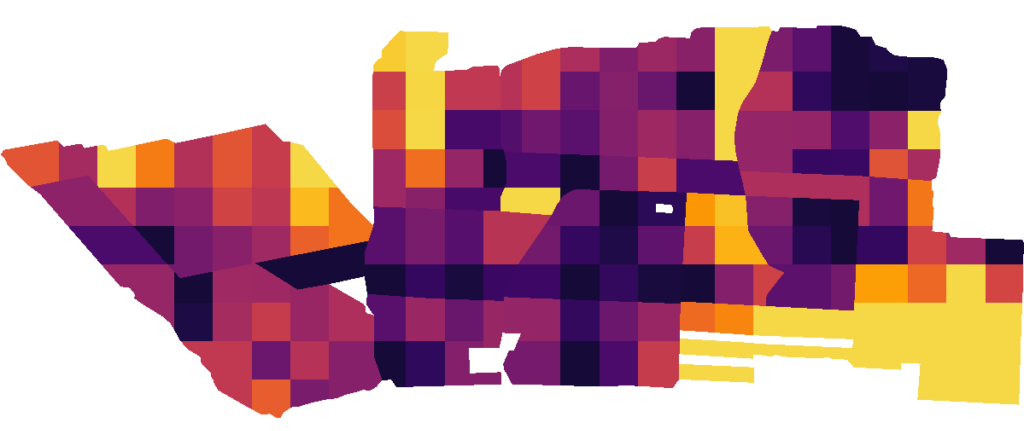
The Cumulative Stress Index quantifies and maps the effects of persistent stress in orchards.
Ceres Imaging can measure relatively small differences in applied water with our thermal imagery, which enables a grower to proactively fine-tune their irrigation across their entire operation. While yields can still fluctuate in response to other drivers, in the long run this will mean higher yields and reduced input costs.
Where do you expect your research to go in the future?
The quality of our imagery is better every season—we never stop improving. We are also looking into what other data sources (satellite, ground sensors, etc.) best complement our high-resolution imagery to give growers more confidence in scheduling irrigation on a zone by zone basis.
To learn more about how the Cumulative Stress Index can help growers maximize ROI in orchards, watch this quick webinar.