
Evapotranspiration (ET) is central to precision irrigation management. An estimate of the combined water loss from evaporation from soil and transpiration from plant surfaces, it plays a key role for researchers and growers in estimating the water demands of a crop.
There are a couple of ways of gauging ET, postdoctoral researcher Srinivasa Rao Peddinti explains. Peddinti is currently working under Dr. Isaya Kisekkai in the Sustainable Agricultural Water Management Research Group at the University of California, Davis.
You can use hydrological and micrometeorological methods up to a point, Peddinti says. But to estimate ET at large spatial scales, remote sensing techniques—satellite or aerial imagery—are more practical, with a combination of field- and remote sensing-based approaches being preferred.
However, there’s a challenge when it comes to using satellite imagery for estimating ET, especially in crops with a large canopy structure, such as almonds. Satellite imagery uses surface energy balance models, and the resolution of these—both spatial, in meters, and temporal, in days—is inadequate.
Testing alternatives to satellite imagery
So, in a study conducted during the 2020 growing season, Peddinti and UC Davis researchers compared how well coarse-resolution Landsat satellite imagery and high-resolution aerial imagery could capture the data used to calculate ET in an almond orchard. Ceres Imaging provided the thermal and infrared mosaicked aerial images captured via airplane throughout the growing season.
The study also installed a Flux tower to collect on-site data and used a model scheme called Two-Source Energy Balance (TSEB) to calculate sensible and latent heat exchanges between the land surface and the atmosphere in the orchard. TSEB is based on an analogy of Ohm’s law, where heat transport is regulated by a gradient temperature and leaf stomata, soil, and air resistances oppose the transport.
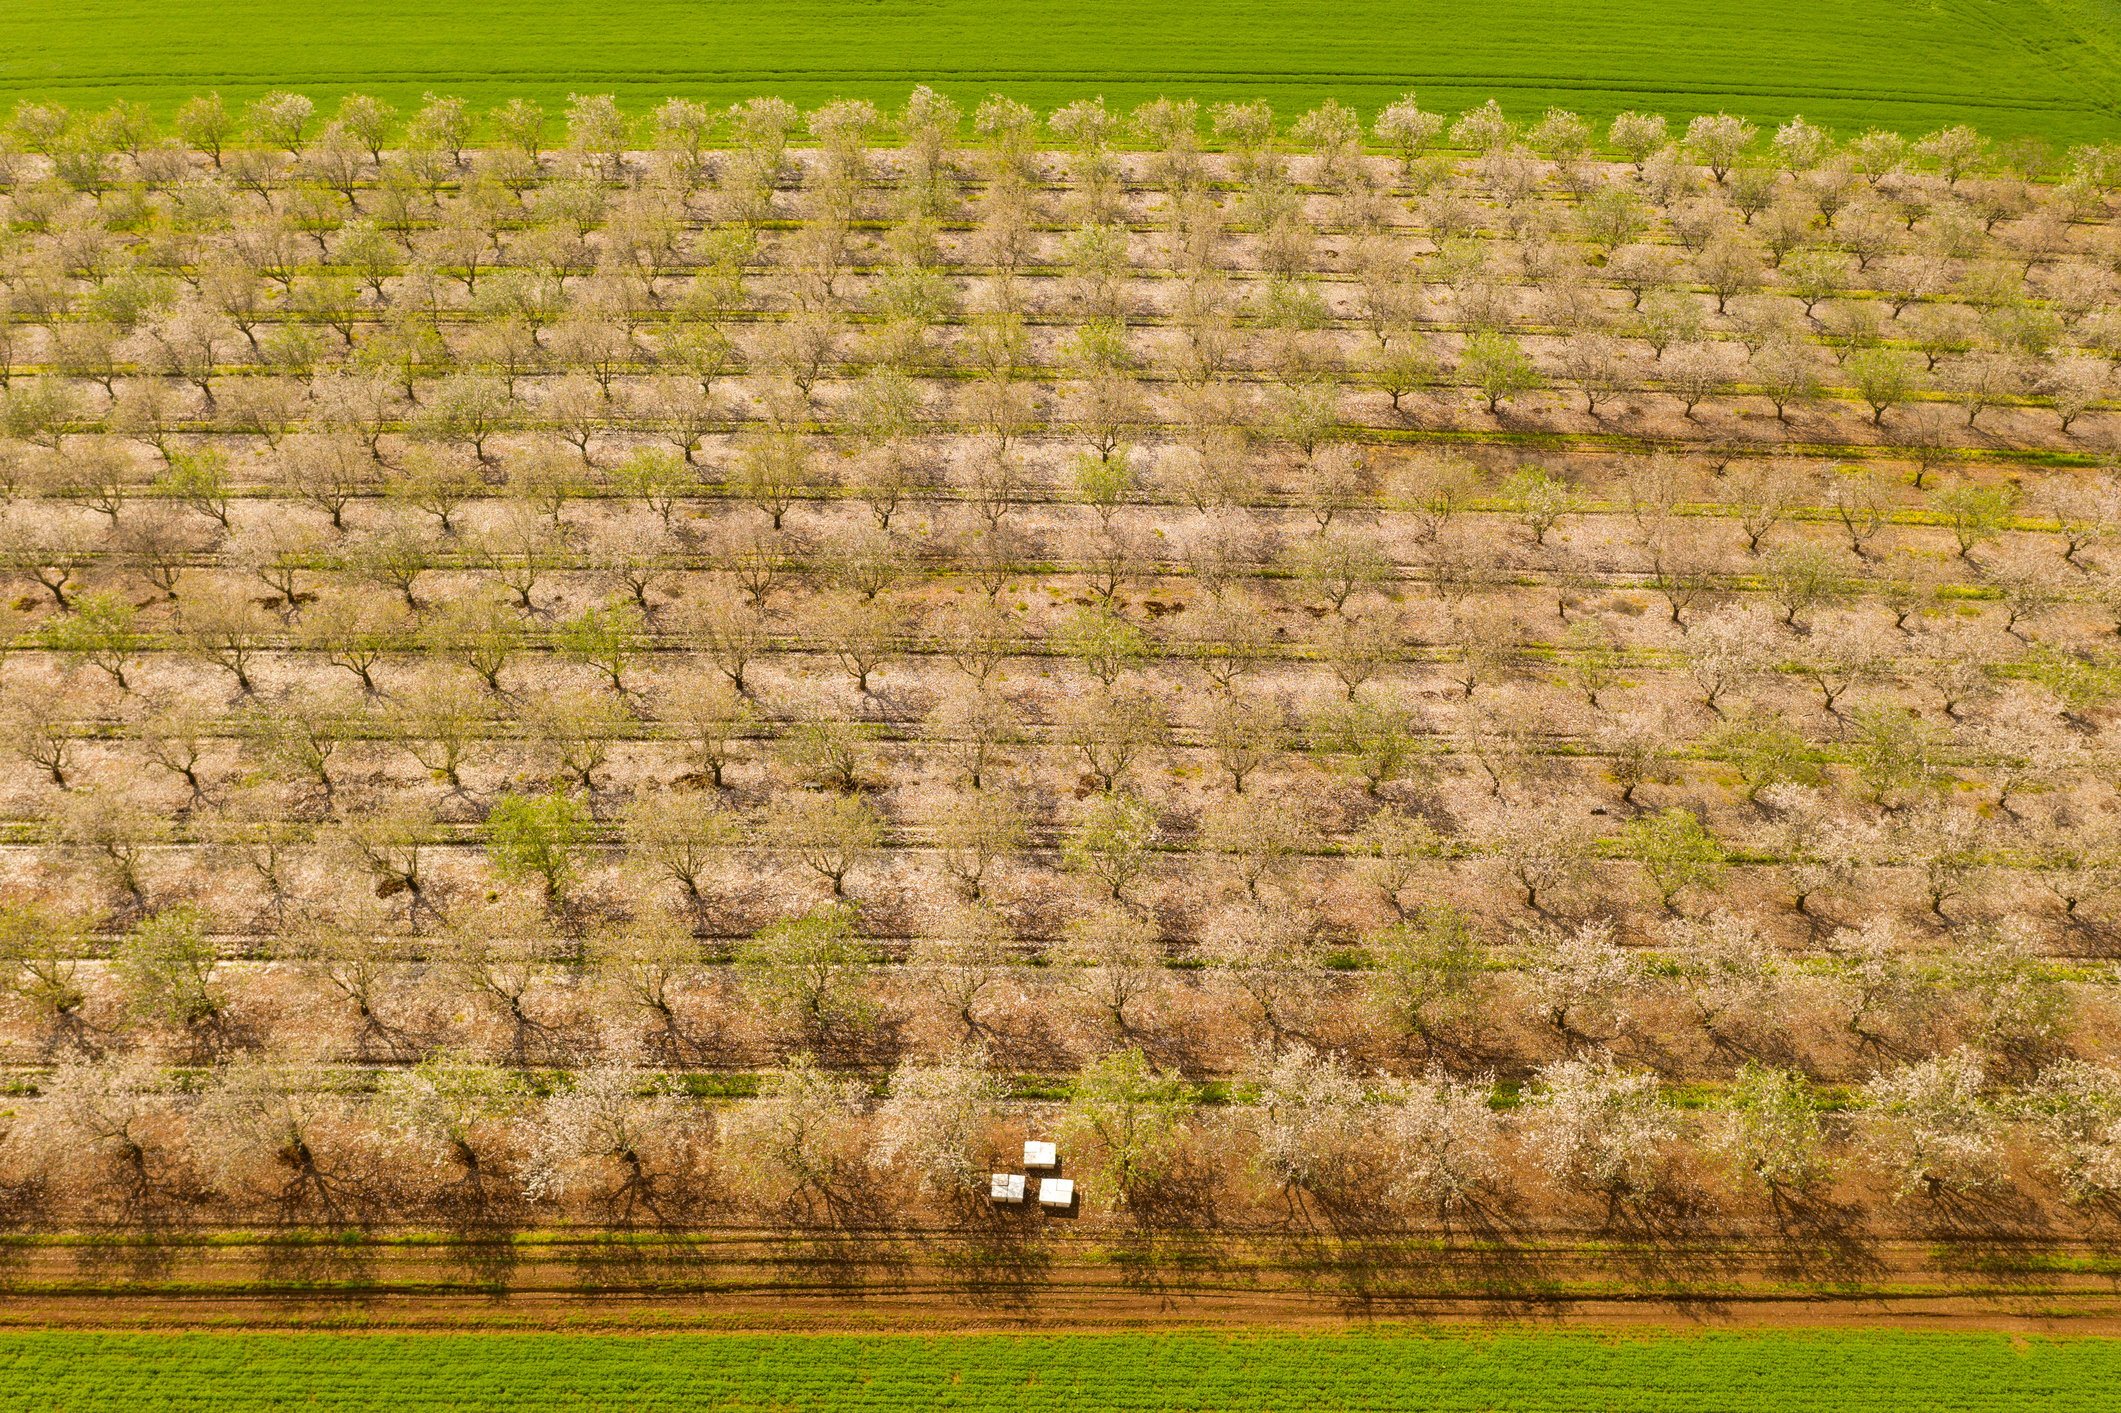
After collecting data from both imaging sources from late June through July, the researchers generated ET maps using the TSEB model, interpolating Landsat data to match the flight dates of the aerial images. The maps generated from Landsat had 30 meter spatial resolution, while the maps generated from aerial imagery had 0.5 meter resolution.
Study findings
While maps from both remote sensing sources showed uniform spatial patterns within the orchard, researchers could not clearly discern irrigation zones or roadways and non-vegetated areas in the Landsat maps due to the coarse resolution. In the Ceres Imaging maps, low ET revealed the locations of the non-vegetated areas—and you could see zone-level variations in the field.
“The analysis showed that the spatially distributed energy fluxes from Ceres Imagery compare well to [the Flux tower’s eddy covariance measurements], but poor correlation was observed for Landsat,” says Peddinti, noting that the aerial imagery used in the study proved to be suitable for mapping spatially distributed heat fluxes at field scale.
“The pixel-by-pixel correlation between airborne and Landsat ET indicated that high-resolution imagery has the capability to show the field-scale features, which is essential for variable-rate irrigation management at field scale.”