
Soil mapping is a task many growers want to tick off their list in the off-season, but getting accurate data can be time-consuming and prohibitively expensive. There is an alternative: growers have the option to build soil zones using aerial imagery.
There are a host of reasons growers invest in soil mapping—from establishing better variable rate application zones, to interpreting yield maps and planning drainage improvements.
Traditional grid sampling is straightforward, but it’s expensive for an approach that won’t always produce an accurate reflection of soil texture variations in the field. And while SSURGO maps can provide a good starting point, they don't provide the level of detail that most operations need to fine-tune management decisions.
There may actually be significant variability in soil type within a single SURRGO map zone.
For that reason, some growers turn to specialized equipment for electrical conductivity (EC) or electromagnetic (EM) mapping. While effective for some operations, for others this ground-level approach is too expensive and too vulnerable to data anomalies produced by variable conditions or improperly gathered data.
Soil maps created from aerial imagery provide a cost-effective alternative for those growers who haven't yet found a practical path to detailed soil data. Ceres Imaging customers who've requested color infrared imagery of bare soil can use the zone creation tool to create soil maps more detailed than SSURGO options, more affordably than through EC testing. Growers can choose from 2 to 25 zones per block, and then import them directly into their applicator technology.
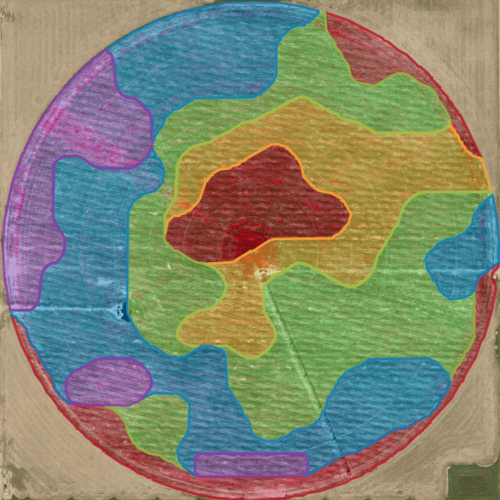
Soil types represented by Ceres Imaging's zone creation tool.
Color infrared imagery incorporates green, red, and near infrared spectral bands. As with any other approach to soil mapping, optimal timing can depend on soil type and moisture content—but Ceres Imaging remote sensing scientist Kirk Stueve, PhD, has some general advice.
“Less residue is better,” Stueve says. “Ideally, you’d have 20% or less residue, consistently distributed on the field.” To achieve this, Stueve recommends capturing imagery on bare soil 10-14 days after tillage, with rain or irrigation within a week of that tillage.
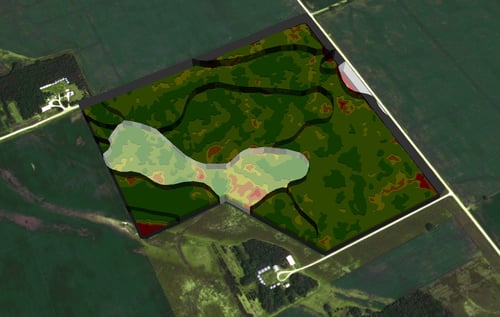
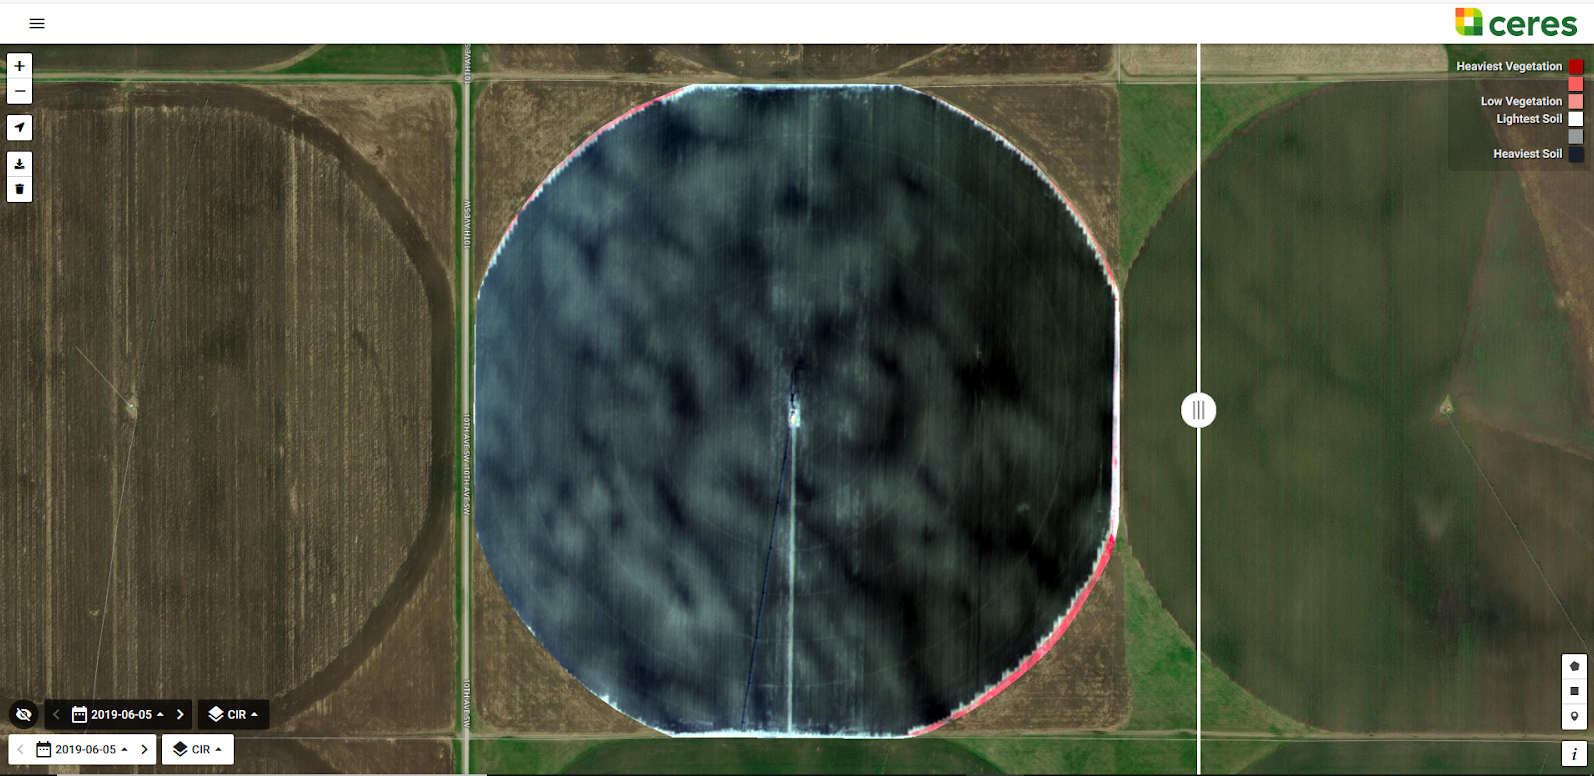
Let's take a closer look at an example. Below, bare soil imagery was taken on a potato field after spring tillage and light irrigation, with a bit of time to dry out. You can see the contrast between dark areas—indicating soil with high organic carbon—and lighter areas with sandier soils.
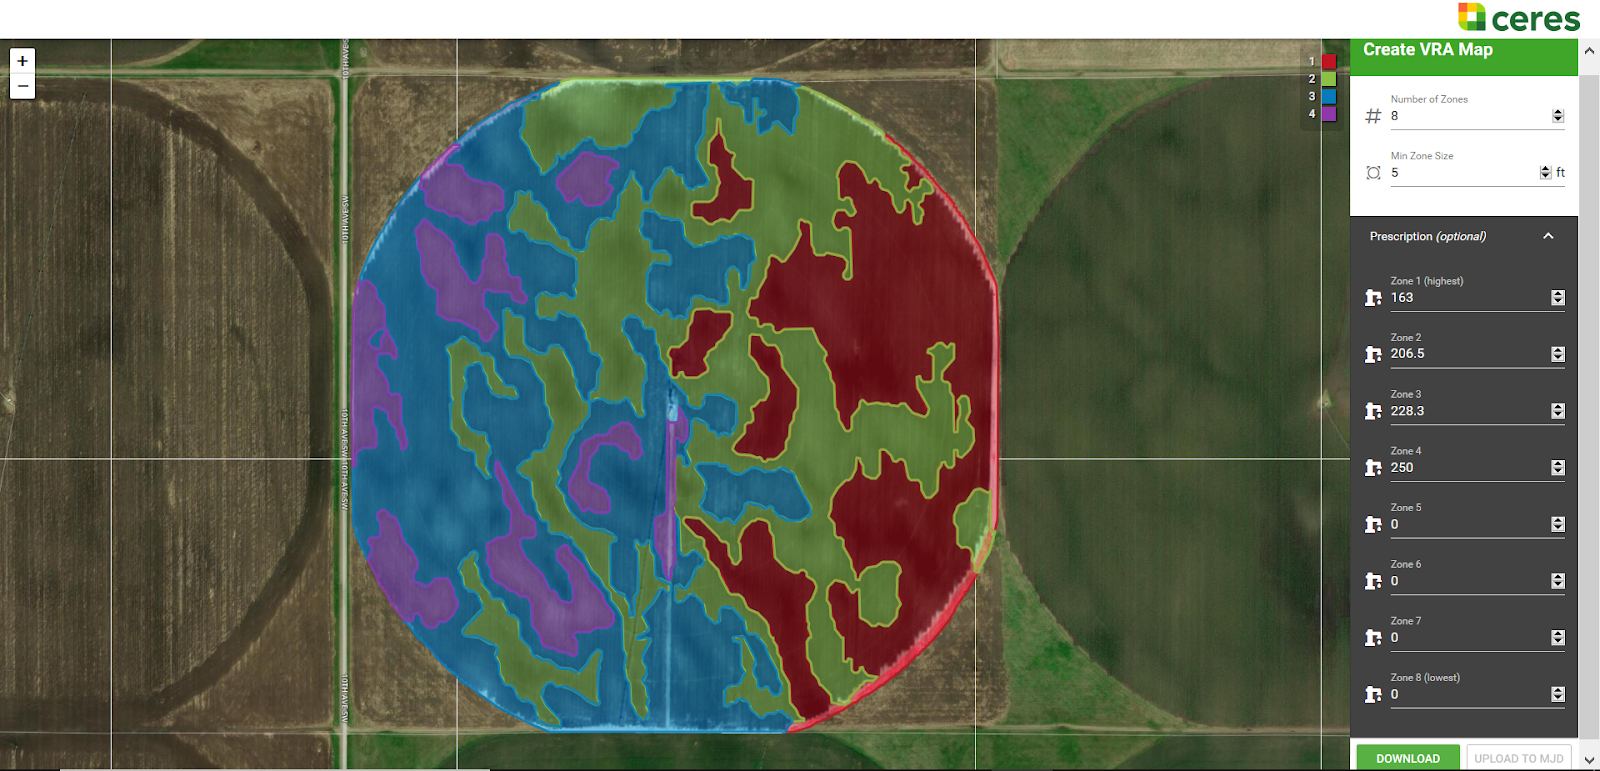
Now, here's the same field shown with VRA zones generated from the bare soil image. The zones will be used to vary nitrogen application across the field: less nitrogen is needed in areas with higher soil organic carbon, which will help reduce the total amount applied—especially important when input prices are high.
Analyzing soil and creating VRA zones is not the only reason growers may consider capturing aerial data even before there's a crop to evaluate. Another is to help ensure that irrigation equipment is functioning correctly before the season gets underway.
Ceres Imaging account manager Jamie Barker notes, “We use bare soil imagery to identify irrigation issues immediately, before they have a big effect on the crop during crucial growing periods early in the season. On center pivots, imagery can expose bad sprinkler packages, pressure regulator issues, bad emitters, and plugged nozzles.”
For more tips, or to schedule a consultation, contact your Ceres Imaging representative.