For a limited time, book a free water stress analysis from Ceres Imaging and test-drive the industry’s most popular aerial imagery solution.

While traditional NDVI imagery measures canopy density, the next-generation Chlorophyll Index assesses canopy quality—offering an accurate representation of plant health throughout the season. It’s a powerful resource for nutrient management, both for in-season adjustments and season-to-season planning.

Ceres Imaging’s Chlorophyll Index incorporates four narrow bands in the visible/near-infrared that are particularly sensitive to differences in leaf chlorophyll content: red, green, red-edge, and near-infrared. This proprietary combination of wavelengths is closely correlated with the nitrogen content of the leaves and relative health of the crop canopy.
Unlike NDVI, chlorophyll imagery does not become “saturated” as the crop canopy matures. This allows the Chlorophyll Index to provide meaningful insights on plant health all throughout the season. Growers typically find the imagery most useful between 80% canopy closure and the early phases of crop senescence. Chlorophyll Index patterns from late July and August are highly correlated with final crop yield in the fall.
High-resolution multispectral imagery is only the beginning. Our analytics tools help you interpret your data—translating what you can see in your imagery into what you can do about it.

Chlorophyll imagery reveals correctable irregularities not visible to field scouts.

Identifying stressed areas in imagery can guide a targeted tissue sampling strategy.

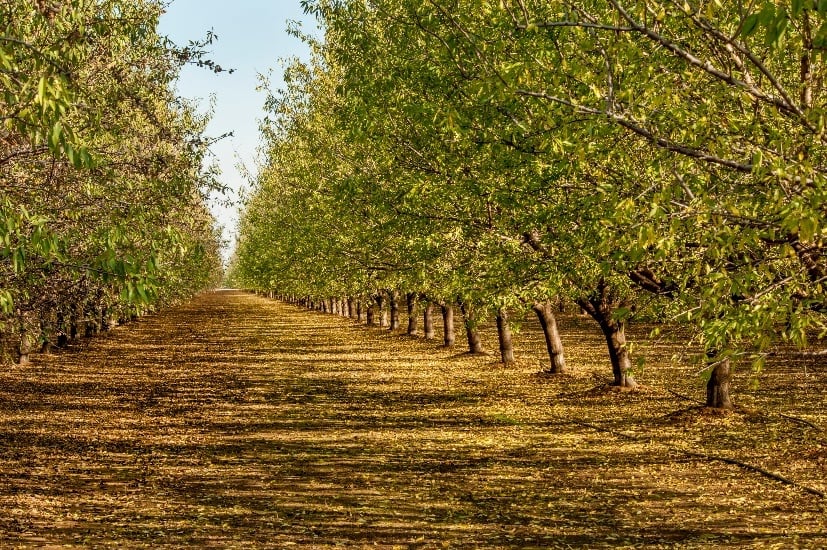
In orchards, the Chlorophyll Index allows growers to optimize stress at the individual plant level.

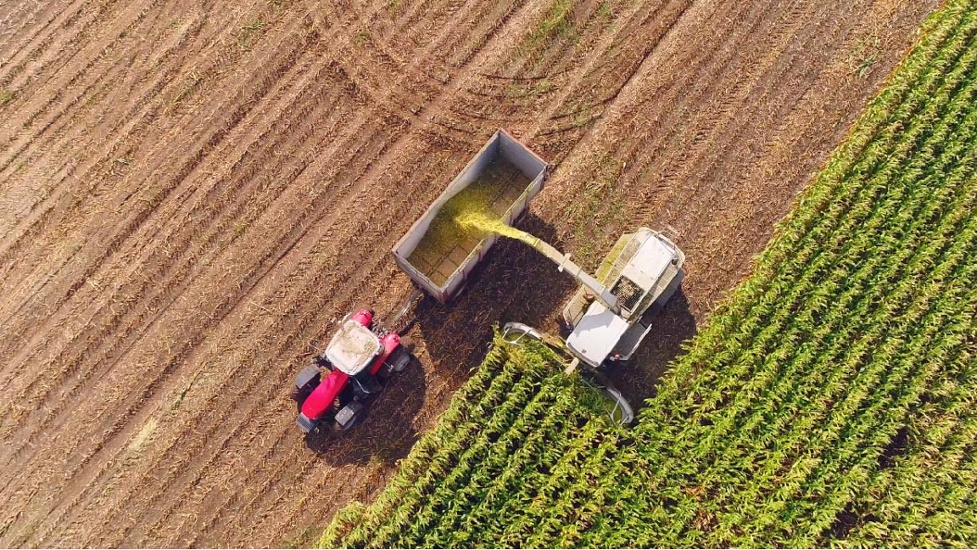
In this field, nutrient deficiencies resulted from alkaline soil and an irrigation equipment failure.
We capture imagery during peak daylight hours and under weather conditions that minimize distortion from shadows and cloud cover. Our highly sensitive, custom-built cameras detect minute changes in the multispectral range—allowing us to detect crop stress earlier than our competitors.
Imagery is geo-referenced and meticulously “masked” to ensure that only relevant information is evaluated. By making use of crop-specific data models and isolating the canopy from ground cover and other background noise, we prevent skewing of the data and enable a more accurate assessment of plant health.
Imagery is assessed in-house by Ceres Imaging’s remote sensing experts, passing through multiple checkpoints before delivery in the Ceres Imaging app within 48 hours of the flight. Growers can access their data on a mobile device, tablet, or desktop computer.
![]()
Schedule a consultation for detailed product info, pricing, and more.

The difference between Ceres Imaging and other technologies I've used is the help I get from their expert team.
With Ceres Imaging we can take a more targeted approach to applying fertilizer and nutrients.
These flights can cover way more ground and provide more insight than a dozen soil moisture probes — and it's cheaper to implement.
The average Ceres Imaging conductance measurement from its imagery over the season has provided the best correlation with applied water.